


Countries require electromagnetic interference (EMI) compliance for a wide range of devices. Because testing for standards compliance can bottleneck the product development process, engineers use pre-compliance testing to uncover issues earlier in the product development cycle.
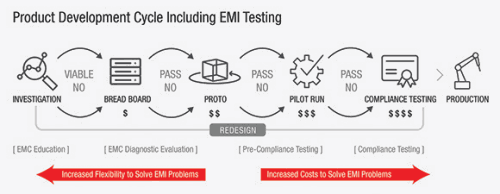
Pre-compliance testing solutions evaluate electromagnetic compatibility (EMC) performance at multiple stages, starting with lab prototypes. Figure 1 illustrates a typical product development cycle.
EMI pre-compliance testing typically includes conducted and radiated EMI emissions evaluations before a product undergoes full compliance testing.
Conducted emissions testing centres on unwanted signals on the AC mains generated by the equipment under test (EUT). The frequency range for these commercial measurements is 9 kHz to 30 MHz, depending on the regulation.
Radiated emissions testing, on the other hand, searches for signals broadcast from the EUT. The frequency range of these measurements is 30 MHz to 1 GHz.
Depending on the regulation, the frequency range can reach 6 GHz or higher.
The highest internal clock frequency of the EUT determines these higher test frequencies. Preliminary testing is known as pre-compliance testing.
To maximise the benefits of pre-compliance testing, the conditions during measurements should closely resemble the actual EMI compliance testing environment. This means performing measurements with the same detectors, resolution bandwidths and measurement times required by the appropriate commercial and military regulations.Using the same software that compliance testing centres use gives design teams more confidence in the accuracy of their pre-compliance testing.
This article covers some key software capabilities that will help you efficiently make EMI pre-compliance measurements with a Keysight X-Series signal analyser running the N6141 PathWave X-Series EMI measurement application.
Key software capabilities
The N6141 EMI measurement application can help you make EMI pre-compliance measurements more easily and efficiently. The application features limit lines, correction factors (for transducers), signal lists with sorting capability, multiple traces, signal maximisation, time domain scanning and more.
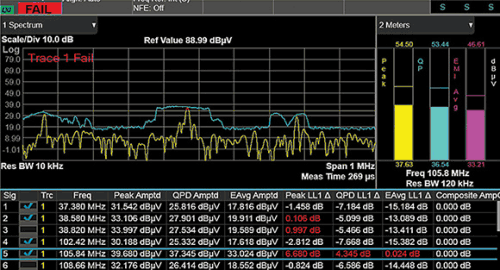
Limit lines
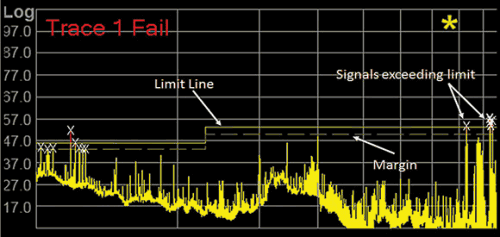
A primary goal of EMI testing is to detect signals that violate a specification. Limit lines find those suspect signals in combination with the following features on a pre-compliance analyser:
• Built-in limit lines for required tests.
• Multiple limits.
• Limit margins.
• Custom limits that users can add alongside the built-in limits.
• Ability to save custom limits.
• Simple pass/fail indicators.
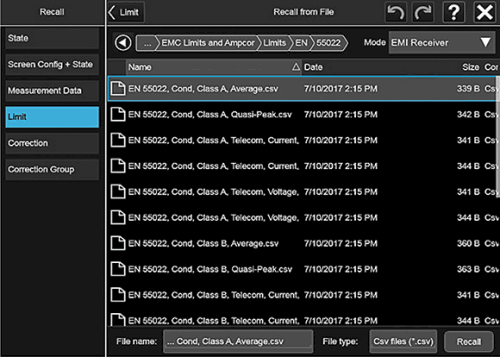
A limit line library, containing a common set of limits, makes it convenient to set up common test scenarios. With custom limits, a user can easily set up any type of measurement.
Limit lines, combined with internal testing that identifies signals over a specific limit, help pinpoint suspect signals for further analysis. To provide room for error, specify limit margins, particularly in a poorly characterised test environment. Many EMI software suites include the built-in capability to add margins to limits.
Correction factors
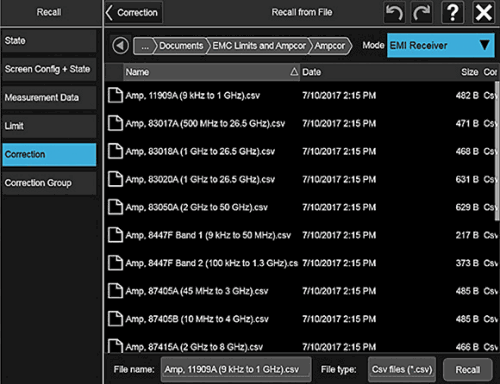
Transducers such as antennas, line impedance stabilisation networks, current probes, current clamps, cables and amplifiers have unique frequency-dependent correction factors that the manufacturer or calibration facility usually supplies. These correction factors are added to or subtracted from the measured amplitude values to compensate for the transducer gain or loss, which allows the receiver to display the actual emission field strength amplitude at the transducer. A good pre-compliance software package should include a library of built-in correction factors. It should also enable custom, user-designed corrections.
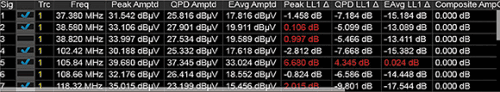
Signal list
A signal list, or suspect list, stores scan results exceeding the limit lines. Typically, a suspect list applies to commercial measurements because the emission values did not utilise weighted detectors. (The limits are quasi peak or EMI-average, not peak.)
Emissions typically exceed the limit when the peak value is over the limit. A list of the suspect signals allows for a more detailed check with the weighted detectors. A signal list, particularly one that identifies duplicate signals, is handy for debugging and troubleshooting failed signals. Some EMI software suites enable sharing of the signal list between applications. This feature allows the user to perform different measurements with the same signal list.
Multiple traces
Having the ability to view and compare multiple traces makes for more efficient diagnosing of EMI issues. Common comparisons include signals from different test setups and before-and-after design/shielding adjustments. The addition of a max hold capability (the trace holds maximum values from repeated scans) facilitates the identification of suspect emissions. The multiple trace capability also allows users to compare the results from different detector types. The ability to export trace results, which users can then forward to other engineering teams, aids in troubleshooting.
You can use multiple traces to generate a suspect list before performing final measurements. Multiple traces using side-by-side comparisons can help capture and record the maximum values of the peak emissions while rotating the turntable and moving antennas. Since turntable and antenna manipulation often requires a significant amount of time, multiple trace support significantly reduces test time.
Signal maximisation
Before making final measurements, make sure to adjust the final measurement frequencies to obtain the maximum signal amplitudes. CISPR recommends this step for improved measurement accuracy. The prescan might not capture these maximum frequencies and amplitudes because of the nature of time-varying measurements or the resolution bandwidth selected by the user. The maximisation process requires rotation of the device under test (DUT), usually with a turntable, while the antenna height varies. Software tools can help capture the maximum signal amplitudes while the DUT is physically adjusted.
One way to perform signal maximisation involves peaking a signal around a small span. The monitor spectrum can identify the frequencies of maximum emissions in your suspect list. This feature offers both live-spectrum and meter displays that make it easy to see emission levels and the maximum while adjusting the centre frequency.
An editable signal allows the user to maximise each suspect signal before the final measurement. After maximisation, the frequency of each signal in the list can be replaced with the value found after maximisation. Final measurements are based on the frequencies of the maximised signals.
Time domain scan
A fast Fourier transform (FFT)-based alternative to sweep/frequency scans, the time domain scan tool can help complete prescans more quickly. It uses high-overlap FFTs to make measurements in larger frequency increments. Unlike the traditional swept methodology, which dwells for each resolution bandwidth, time domain scan dwells only once per FFT bandwidth.
The time savings can vary but often reach around two orders of magnitude. While time domain scan capability requires a paid option for most EMI software, the feature earns a consideration given the time savings. This type of FFT scanning is becoming more prevalent among automotive companies and for test setups requiring long rescan times.
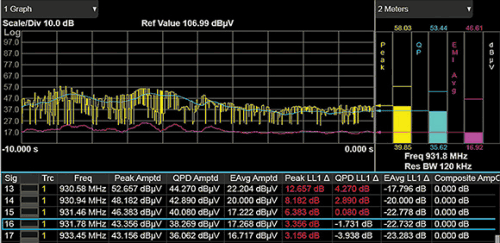
Measuring unsteady emissions
When measuring unsteady emissions, including turntable setups, it helps to have a time domain-based measurement view that plots emissions over time and displays the highest emission values. This process produces a history of the device’s emissions, allowing for detailed analysis. When using a turntable, you can map this information back to its rotation and find the point of maximum emissions. In pre-compliance testing, having diagnostic tools that identify the sources of problem signals ensures that critical issues do not go unnoticed.
Testing household appliances
Design teams testing household appliances need to test according to CISPR 16 and CISPR 11 regulations. Such testing usually revolves around detecting certain disturbances known as clicks. These requirements are rather rigorous and early detection of possible issues can shorten test cycles. The EMI software should not only detect problematic signals, but also produce a report containing a list of the rules that the device under test failed. CISPR defines a number of exceptions related to the number and nature of the clicks found. The software should account for these exceptions when determining the pass/fail results.
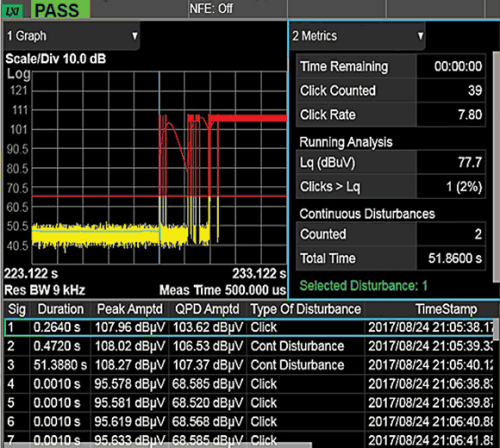
Report generation
A reporting feature helps communicate EMI issues for other engineering teams to analyse and resolve. Such a report can contain trace data, signal list, limits, correction factors, screenshots and important header information. In the case of click analysis, matching EMI failures with the relevant CISPR standard can aid interpretation and resolution.
Conclusion
The use of appropriate software tools can enhance EMI pre-compliance testing. An effective pre-compliance testing methodology will reduce test cycle times, which ultimately impacts a company’s bottom line. The Keysight N6141 PathWave X-Series EMI measurement application, when combined with a Keysight X-Series analyser, can be a powerful addition to a company’s EMI pre-compliance portfolio. It has a rich feature suite with the tools described above and much more.
| Tel: | +27 12 678 9200 |
| Email: | info@concilium.co.za |
| www: | www.concilium.co.za |
| Articles: | More information and articles about Concilium Technologies |


© Technews Publishing (Pty) Ltd | All Rights Reserved
 printer friendly version