


This drive toward ubiquitous, real-time sensing has shifted requirements for liquid sensors to smaller size, higher robustness and lower power, while still delivering high-quality results.
As the industry advances, intelligent platforms for on-the-go sensing are needed. These platforms need to be highly versatile, capable of satisfying unique requirements for a wide range of applications from environmental waters to process control. This article will introduce a portable, real-time sensing solution and prototyping platform for rapid liquid sensing.
A common liquid analysis technique
Various methods exist to test liquids, the purpose being to measure the concentration of an unknown parameter in a sample, such as pH, fluorescence or turbidity. A popular method is to evaluate liquids optically, as it is non-invasive and provides stable and accurate results.
Precision optical liquid measurements require mixed domain knowledge in electronics, optics and chemistry. In simple terms, the analysis begins with a sample that is exposed to light from a source such as an LED. After interacting with the sample, the resulting light is processed by a photodiode. That measured response is plotted against the measured responses of a set of standard samples of known concentrations. This is known as a calibration curve (Figure 1).
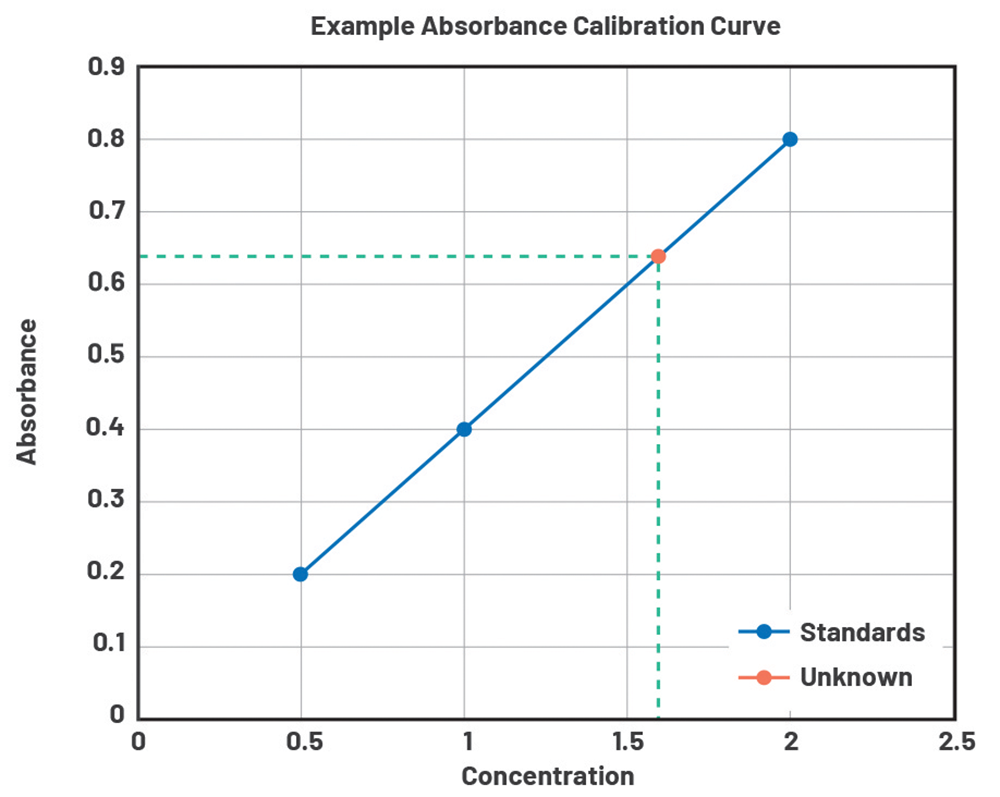 Figure 1. An example of a calibration curve for absorbance.
Using the calibration curve, the unknown value can be determined. This describes the general laboratory method for analytical measurements, but to meet the needs of ubiquitous sensing it must be scaled to different analytes and measurement techniques, as well as fit into a small form factor, all of which increases the complexity of design and evaluation.
Modular solution for rapid liquid measurement
The ADPD4101 from Analog Devices is an optical analog front end (AFE) capable of driving LEDs and synchronously receiving and processing signals from photodiodes to make high-precision optical measurements. The chip is highly configurable, featuring a high optical signal-to-noise ratio of up to 100 dB and high ambient light rejection provided by on-chip synchronous detection methods, allowing it to be used without an optically dark enclosure in many cases.

The CN0503 reference design (Figure 2) was created to enable rapid prototyping of liquid analysis measurements with the ADPD4101. The design features the ADPD4101 as its core product, but adds up to four modular optical paths as well as measurement firmware and application software targeted for liquid analysis. The CN0503 interfaces directly with the ADICUP3029 board, which manages the measurement routine and data flow. The ADICUP3029 board can be connected directly to a laptop to view results in the evaluation GUI.
The CN0503 can measure fluorescence, turbidity, absorbance and colourimetry. A sample is prepared in a cuvette and placed in the 3D-printed cuvette holder, which houses the optics, including a lens and beam splitter. The cuvette holder slots into the appropriate optical path for plug-and-play measurement. In addition, the LED and photodiode cards can be switched out for even more customisation.
To demonstrate the creation of calibration curves and measurement of unknowns with the CN0503, measurements of pH, turbidity and fluorescence will be shown hereafter. The evaluation GUI was used to take measurements to create calibration curves. The noise value and limit of detection (LOD) were calculated to determine the lowest concentration feasible to be detected by the CN0503 for each example.
Measuring pH with absorbance
Absorbance background
Absorbance involves determining the concentration of a known solute in a solution based on how much light is absorbed at a particular wavelength. The concentration is proportional to the absorbance, per the Beer-Lambert Law. Many colourless analytes can be measured by adding a colour-changing reagent.
The example under examination in this article is measuring pH, one of the most common parameters measured across many industries, from water quality to wastewater treatment. Absorbance measurements are used for many other parameters, including dissolved oxygen/biological oxygen demand, nitrates, ammonia and chlorine.
Optics

The optical path configuration for absorbance measurements is shown in Figure 3. With the CN0503, absorbance measurements can be made in any optical path (1 through 4). The incident beam is directed at the beam splitter, where a reference photodiode samples the intensity of the beam. The remaining power is directed through the sample. Taking the ratio of sample to reference light removes variation and noise of the LED source and synchronous pulse and receive windows provide ambient light rejection.

Set-up equipment:
• CN0503 evaluation board (Figure 4).
• EVAL-ADICUP3029 evaluation board.
• API pH test and adjuster kit.
• pH standards.
In this experiment, a colour indicator (bromothymol blue) was added to prepared solutions with different pH values. The solutions were transferred into cuvettes and tested at two different wavelengths – 430 nm and 615 nm
– where the indicator shows absorption changes vs. pH. The CN0503 makes this easy; the two different-wavelength LED cards can be inserted into optical path 2 and optical path 3, then the cuvette holder is simply moved into different paths for the different measurements.
Results
Using the CN0503 evaluation GUI, measurement results from both optical paths were easily exported into Excel. The resulting calibration curves for the two different wavelengths are shown in Figure 5 and Figure 6.
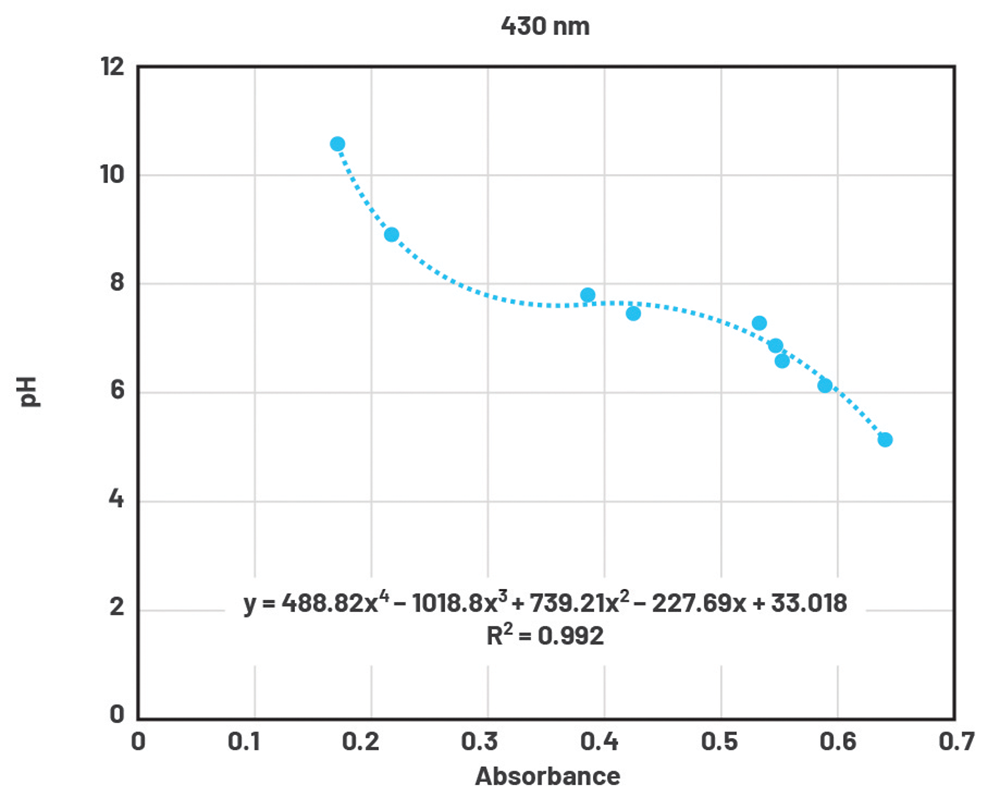 Figure 5. Absorbance calibration curve of pH at 430 nm
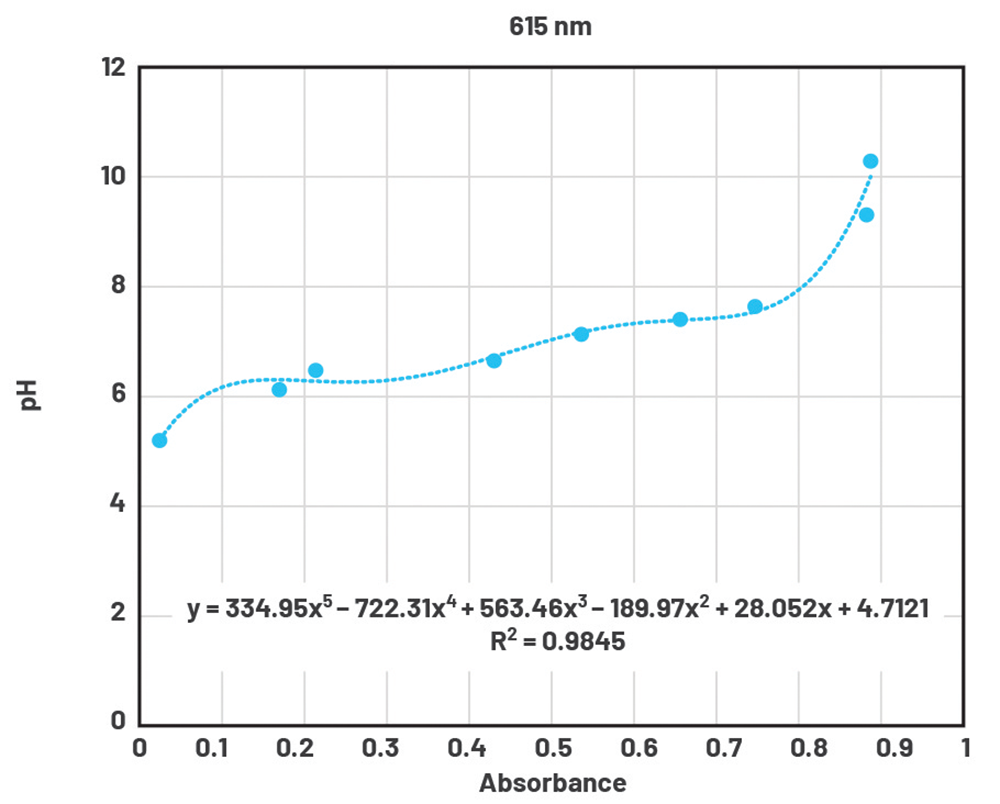 Figure 6. Absorbance calibration curve of pH at 615 nm.
In each case, the pH vs. absorbance was plotted to create the calibration curve. The ‘Add Trendline’ option is then used to get an equation for the curve and the equations are then used to determine concentrations of unknown samples. The sensor output is the ‘x’ variable and the resulting ‘y’ value is the pH. This can be done by hand; however, the CN0503 can also be used for this. The firmware implements two fifth-order polynomials, INS1 and INS2. Once the polynomials are stored, the INS1 or INS2 mode can be selected so that measurement results are reported directly in the desired unit – in this case, pH. This makes it simple to quickly get a result for an unknown sample.
To get the noise value, two different data points were chosen for each wavelength: one lower pH value and one higher pH value. Two points were used because the curve fit was not linear in this case. The standard deviation of a set of repeated measurements for each point, reported as the noise value in Table 1, describes the precision of the measurement, excluding variations in sample preparation.
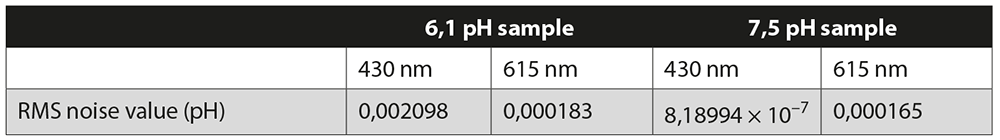 Table 1. pH measurement noise values.
LOD is typically determined by measuring noise at low concentration and multiplying by three to give a confidence interval of 99,7%. Because pH is a logarithmic scale, pH 7 was chosen as the number to check the LOD, as shown in Table 2.

Measuring turbidity
Turbidity background
Turbidity measurements of a liquid sample use the light scattering property of particles suspended in the liquid. Ultimately, it is a measure of the relative clarity of a liquid. The amount of light scattered and the scattering angle differ based on particle size, concentration and the wavelength of incident light. Measuring turbidity is conducted in many industries, including water quality and life sciences. Besides general turbidity, the CN0503 could be used to determine algae growth by measuring optical density.

Optics
Figure 7 shows the optical path for turbidity measurement with a 90° or 180° detector. With the CN0503, turbidity measurements can be made in optical path 1 or 4 only, as a 90° detector is needed. There are various measurement configurations and standards for turbidity. This example demonstrates a modified version of EPA Method 180.1, calibrated and reported in nephelometric turbidity units (NTU).

Set-up equipment:
• CN0503 evaluation board.
• EVAL-ADICUP3029 evaluation board.
• Hanna Instruments’ turbidity standard calibration set (Figure 8).
For this experiment, optical path 4 was used with the 530 nm LED board inserted for testing.
Results
Using the CN0503 evaluation GUI, measurement results were exported into Excel. The resulting calibration curve is shown in Figure 9.
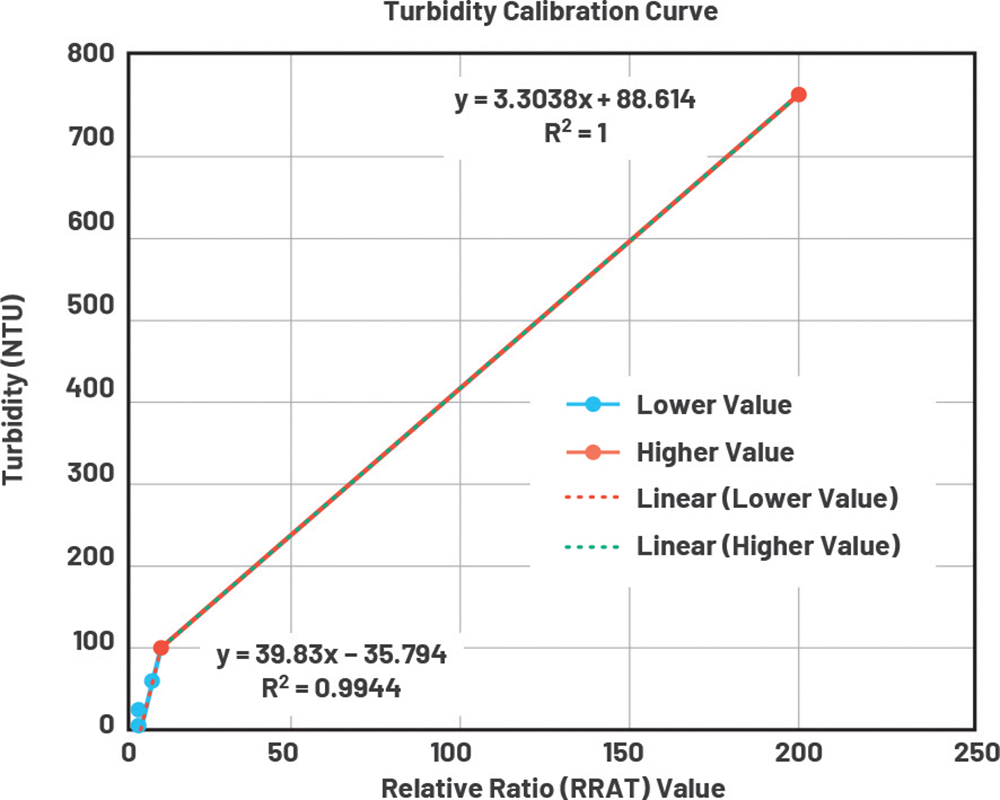 Figure 9. Calibration curve for turbidity.
The response curve was split into two sections because the 90° scattering measurement is less responsive to high turbidities. One section represents lower turbidity (0 NTU to 100 NTU) and the other represents higher turbidity (100 NTU to 750 NTU). Two linear fits were then made to each section.

Even though there are now two equation values, the CN0503 can still be used to quickly show resulting NTU values. This is because each optical path can store its own equation values in INS1 and INS2. One important note is that INS1 and INS2 are dependent. The result of the first equation, INS1, is the input variable for the second equation, INS2. Once the equation values are stored, INS1 can be used to measure lower-turbidity samples and INS2 for higher-turbidity samples.
To get the noise value, we choose a data point to take the standard deviation of repeated measurements. The standard deviation is the noise value. One data point is chosen near the bottom of the range because the equation fit is linear.

To determine the LOD, the noise value is measured for a blank or low concentration sample (Table 3), then multiplied by three to represent a 99,7% confidence interval (Table 4).
Measuring fluorescence with spinach solutions
Fluorescence background
When light is shined into a sample containing fluorescent molecules, the electrons move into a higher energy state and then lose some of that energy before emitting light at a longer wavelength. The fluorescence emission is chemically specific and can be used to identify the presence and number of specific molecules in a medium. In this example, fluorescing chlorophyll was demonstrated by using spinach leaves. Among many applications, fluorescence measurements are common in biological assays, dissolved oxygen, chemical oxygen demand and detecting if pasteurisation has been successful in milk.
Optics
The optical path configuration for fluorescence measurements is shown in Figure 10. With the CN0503, absorbance measurements can be made in optical paths 1 or 4 only, which is because of the 90° detector. Usually, a fluorescence detector is positioned at 90° from the incident light and a monochromatic or long-pass filter is used to increase isolation between the excitation and emitted light. Fluorescence is a very sensitive low-level measurement and is subject to interference, so the reference detector and the synchronous detection methods are used to reduce error sources.
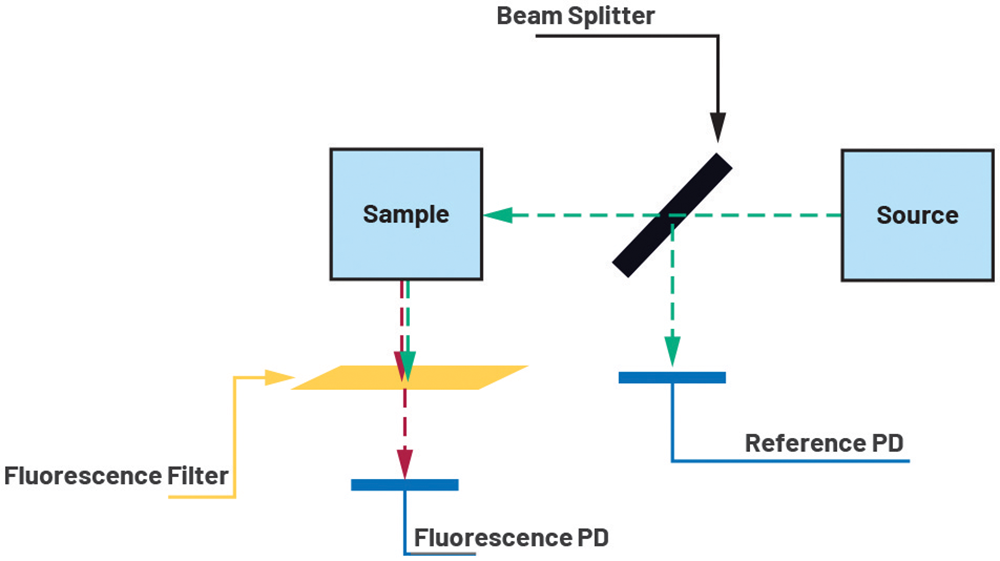 Figure 10. Optical path for fluorescence measurement.
Set-up equipment:
• CN0503 evaluation board.
• EVAL-ADICUP3029 evaluation board.
• Spinach solution.

For this experiment, a spinach solution was created by blending spinach leaves with water. This was then filtered and kept as the stock solution. The stock solution was then diluted to result in samples of different percentages of spinach solution (Figure 11). These were used as standards to create a curve of % spinach solution through fluorescence. Optical path 1 was used along with the 365 nm LED card and the long-pass filter inserted.
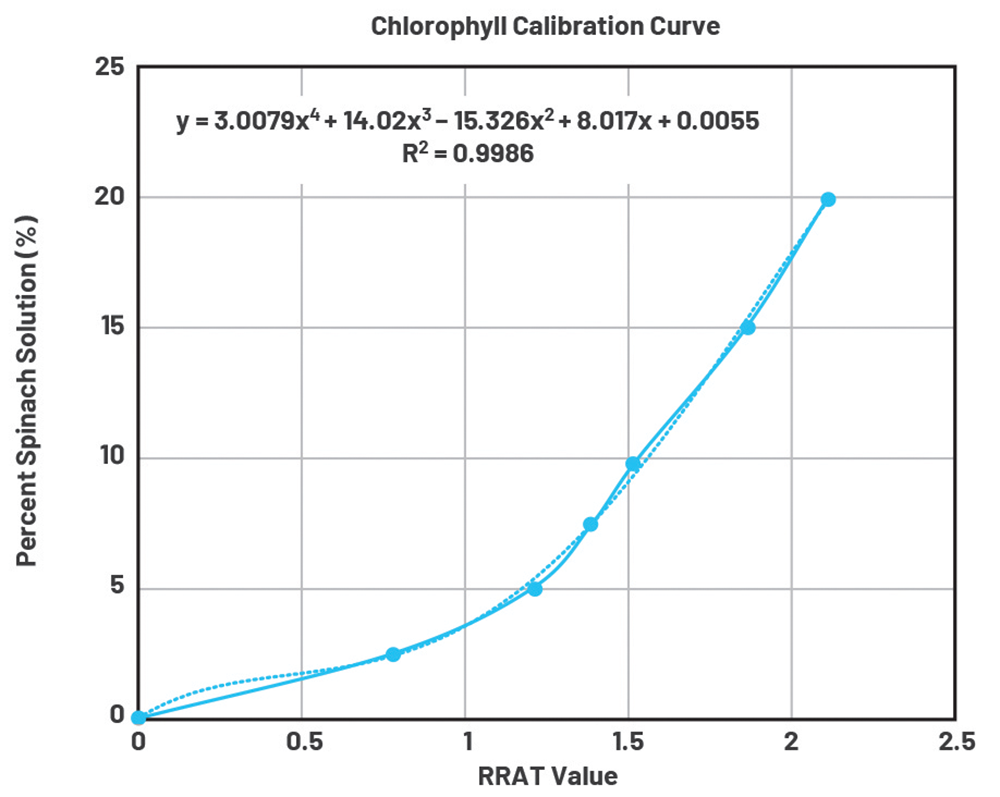 Figure 12. Calibration curve for percent spinach solution.
Results
The calibration curve for % spinach solution is shown in Figure 12. The trendline equation for this calibration curve can be stored so that the results are directly reported as a percentage by the CN0503. To get the noise value, two different data points were picked: one near the bottom of the range and one near the top, because the curve fit was not linear. The noise is given by the standard deviation of a set of repeated measurements for each point, as shown in Table 5.
 Table 5. Fluorescence measurement noise value.
To determine the LOD, the noise value is measured for a blank or low concentration sample, then multiplied by three to represent a 99,7% confidence interval (Table 6).

Conclusion
Prototyping complex optical liquid analysis measurements is a challenge that requires careful consideration of how chemistry, optics and electronics interact to produce a precise result. Integrated analog front-end products like the ADPD4101 pave the way for higher-performance optical liquid sensing in smaller spaces.
The CN0503 builds on the ADPD4101, including optical design, firmware and software for an easy-to-use and highly customisable rapid prototyping platform that is capable of taking accurate optical measurements of liquid parameters, including absorbance, colourimetry, turbidity and fluorescence.
| Tel: | +27 11 923 9600 |
| Email: | info@arrow.altech.co.za |
| www: | www.altronarrow.com |
| Articles: | More information and articles about Altron Arrow |


© Technews Publishing (Pty) Ltd | All Rights Reserved
 printer friendly version