


New information technology in the form of the Internet of Things (IoT) is changing our lives. The Bluetooth low energy (BLE) standard is aimed at IoT applications and dramatically extends battery life. In order to implement it, there is a need to reduce the amount of unused power from existing devices, and engineers are therefore exploring component level dynamic current consumption, which is difficult to measure, especially for low-power devices used in IoT enabled products, because of the limited dynamic range, large measurement noise and limited bandwidth.
Problems with present solutions
In order to meet the demands for power consumption reduction, precise dynamic current waveform measurement and debug are required. However, there are a number of difficulties to be resolved, as follows:
Limited dynamic range: For example, most of the battery-powered devices have a low-power sleep mode that consumes very little supply current (less than 1 μA) while the active mode usually requires more than 10 mA. It is difficult to measure such a wide dynamic range of currents with a single measurement.
Large measurement noise: Clamp-on type current probes are widely used, but measuring low-level current less than 1 mA is always difficult due to the large noise floor. Using a shunt resistor and an oscilloscope is very useful, but the minimum measurable current is limited due to the noise floor and the voltage drop across the resistor.
Limited bandwidth: Low-level current waveform measurements with a certain level of resolution need a trade-off with bandwidth, otherwise wideband measurements may degrade the resolution. Using a multimeter or an ammeter is popular for high resolution measurements, but not appropriate for wideband current measurements due to the lower bandwidth.
Multiple instruments required: A multimeter is commonly used to measure the averaged sleep current, while the active current can be captured using an oscilloscope. The total power and current consumptions must be manually estimated from these results, but the data is not always reliable and it can be time consuming to validate it.
Solution
The CX3300 series of device current waveform analysers can solve the problems that engineers can be faced with when measuring the precise dynamic current of BLE devices.
These analysers open up the possibility for a single measurement covering sleep to active mode with a 14- or 16-bit wide dynamic measurement range which clearly visualises even low-level current waveforms. The dynamic current waveform in sleep mode is clearly visible using ultra-low-noise current sensors.
The narrow and sharp peak or spike current is captured by the instruments’ wide bandwidth (up to 200 MHz), 1 GHz maximum sampling rate and 256 MB memory depth, so that any unexpected noise or other interferences can easily be eliminated.
As well as capturing the current waveform, the voltage passive probe can simultaneously capture the voltage waveform, enabling the user to precisely estimate the power consumption. Long learning periods for the user are eliminated thanks to an intuitive, touchscreen-based graphical user interface (GUI) and familiar functionalities.
Measurement setup example
Figure 1 shows the block diagram of the Idd measurement of a BLE device. The CX1101A single-channel current sensor (which is one of the current sensors of the CX3300 and has maximum 100 MHz bandwidth, a current measurement range from 40 nA to 10 A and 40 V maximum voltage) is connected between the power supply and the device under test (DUT) for current measurement.
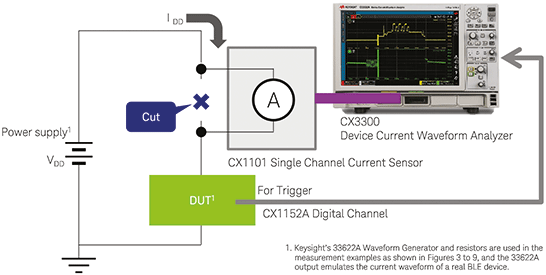
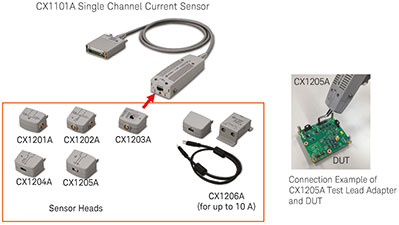
The ideal connection interface for the DUT can be selected from the six sensor head adaptors that can be easily and safely attached to and detached from the CX1101A current sensor as shown in Figure 2. The SMA connector type adaptors enable wideband measurements, while twisted pair and test lead adaptors are useful for quick current waveform measurements that do not necessarily need a wide bandwidth.
Measurement examples
Figure 3 shows the current waveform measured using a CX1101A for simulated Idd of an advertising event, from standby to advertising state of a BLE device. Up to 10 mA flows during the active mode, but little current flows during the sleep mode.
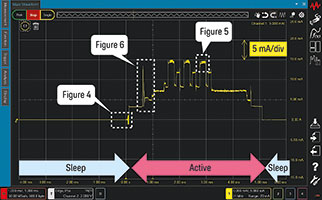
The current during sleep mode is quite small, but the device is in sleep mode most of the time, impacting on the total power consumption, and the precise current measurement during sleep mode is one of the key parameters when evaluating a BLE device.
The current during active mode is also important for power consumption, because the current level is large. In addition, the precise current waveform during active mode is useful for the debugging of the operation on the circuit because it is altered by the various internal circuit operations such as a microcontroller, a DC-DC converter and other peripherals on the circuit. As shown in Figure 3, due to the wide dynamic range, the CX3300 can cover from sleep to active mode with a one-time measurement. Figures 4 to 6 show the zoomed waveform of Figure 3 in more detail.
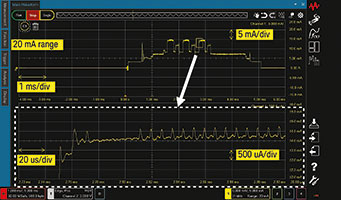
Figure 4 shows the zoomed current waveform of Figure 3 for both horizontal and vertical axes during sleep mode. This detail is possible to obtain by using the powerful zoom function of the CX3300, called ‘Anywhere’ zoom, which allows the user to zoom in on any area shown with a rectangular mark.
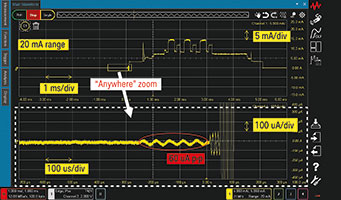
As shown in the 60 μA peak-to-peak sine waveform of Figure 4, an actual BLE device can also have a periodic or non-periodic current because of the integrated switching converter pulse, sleep timer clock and so on, even in sleep mode. At one time, it was difficult to observe such current because no instruments were available with enough bandwidth, dynamic range and noise floor. Using the CX3300 it is possible to identify such characteristics because of its wider bandwidth, wider dynamic range and ultra-low noise floor.
Figure 5 shows the zoomed current waveform of Figure 3 during the active mode. Thanks to the 14-bit wide dynamic range, the small change in the large current is clearly observed as shown in the zoomed waveform. Such current waveform provides insight into the behaviour of internal circuits and processes, and the CX3300 can be a very powerful tool for developing, debugging and troubleshooting products.
The actual Idd line would include many noise sources or unexpected current spikes other than the target current; these would be caused by noise from the power source, operation of other peripheral circuits, and so on. As shown in Figure 6, the CX3300 features various analysis functions such as FFT, histogram or post-filters, that help to obtain the target current waveform and isolate the cause of the noise or spikes.
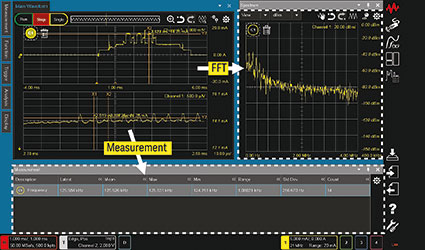
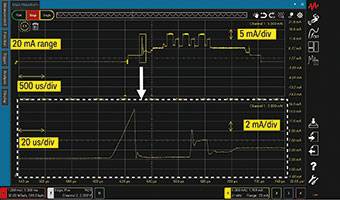
Figure 7 shows the zoomed current waveform of Figure 3 at the wake-up area. Usually these spikes are suppressed by decoupling capacitors and not directly delivered to the power supply side. However, the current waveform without the decoupling capacitors could provide an insight into understanding what happens in the circuit for the purposes of design verification or troubleshooting. At one time, it was difficult to observe this kind of spike because of the limitations of the bandwidth and the resolution; however, the CX3300 has the capability to observe a crisp, detailed spike waveform due to its wide bandwidth and low-noise front end.
As shown in Figures 3 to 7, the CX1101A single-channel current sensor has wide dynamic range that allows observation of the current waveform from sleep to active mode. Furthermore, if wider dynamic range is required, the CX1102A dual-channel current sensor is available.
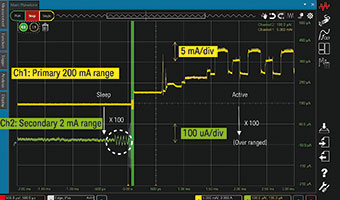
The dual-channel current sensor enables simultaneous measurements under two different measurement ranges. For example, the primary channel is set to a 200 mA range, while the secondary channel is set to a 2 mA range (primary channel range is 100 times more than secondary channel range). This current sensor is very useful for low-power applications that periodically operate in both sleep and active mode. Figure 8 shows the concept of the dual-channel current sensor; it has two channel outs to provide simultaneous low- and high-gain views for wider dynamic range measurements.
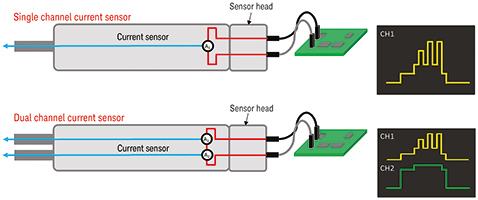
Figure 9 shows the same measurement as Figure 4 with the CX1102A. As shown in Figure 9, the CX1102A enables simultaneous measurement of a current waveform for both sleep and active mode.
Analysis of the power or current profile is essential in order to know how much current is consumed at a certain event or status, but it is a time consuming process. As shown in Figure 10, automatic power and current profiler functions can eliminate time consuming power and current profile analysis. This profiler automatically draws lines in the time scale by the vertical level difference and instantly calculates key parameters such as average current, max /min current, accumulated charge, etc. for each segment in the adjacent table. The user can also manually adjust the segment according to the measured profile.
| Tel: | +27 12 678 9200 |
| Email: | [email protected] |
| www: | www.concilium.co.za/test-measurement |
| Articles: | More information and articles about Concilium Technologies |


© Technews Publishing (Pty) Ltd | All Rights Reserved
 printer friendly version