


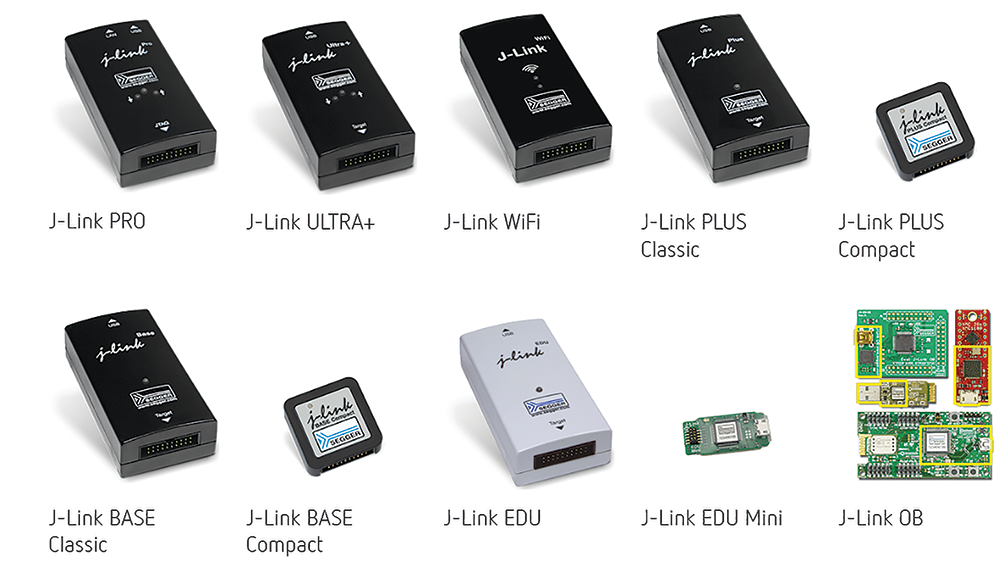
Segger’s J-Link offering is among the most widely used line of debug probes on the market, having provided solid value to embedded development for over a decade. Their performance, extensive feature set, number of supported CPUs and compatibility with popular environments make these tools a popular choice.
J-Link debug probes are widely used for optimising the debugging and Flash programming experience, featuring Flash-loaders with up to 3 MBps RAM download speed and the ability to set an unlimited number of breakpoints in the Flash memory of MCUs. J-Link also supports a wide range of CPUs and architectures – everything from a single 8051 IC and the mass-market Arm Cortex-M, to high-end cores like Cortex-A (32- and 64-bit).
J-Link enables direct interfacing of SPI Flash memory without the need for a CPU between the probe and the SPI Flash. J-Link is supported by all major IDEs, from free Eclipse-based ones (directly or via GDB) up to commercial-grade ones, including Segger Embedded Studio.
J-Link makes Flash memory feel almost like RAM. Since it comes with a set of speed-optimised, built-in Flash-loaders, it can easily and quickly be downloaded into Flash memory.
The J-Link software and documentation package (which is available for download) includes a significant number of tools that make a developer’s job easier and extend the capabilities of J-Link. Almost all J-Link tools have cross-platform support and run on Windows, Linux and macOS.
Ozone debugger and performance analyser

Ozone is a full-featured graphical debugger for embedded systems. Thanks to features such as trace, code profiling and code coverage analysis, it is also a very powerful performance analyser. Ozone allows for the debugging of any embedded application at C/C++ source and assembly level, loading of applications built with any toolchain/IDE, or even debugging the target’s resident application without any source.
Ozone includes all well-known debug controls and information windows, making use of the best performance of J-Link and J-Trace debug probes. The user interface is highly intuitive yet fully configurable – each window can be moved, resized and docked to fit developers’ needs.
SystemView embedded systems analysis
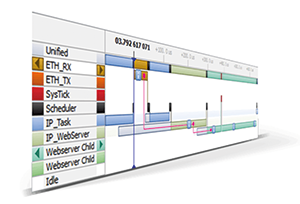
SystemView ensures that systems perform as they are designed. It is a real-time recording and visualisation tool for embedded systems that reveals the true runtime behaviour of an application, which is exactly what is needed when working with complex embedded systems.
SystemView tracks down inefficiencies, shows unintended interactions and resource conflicts, and does so with a focus on the details of every single system click.
Embedded Studio all-in-one solution
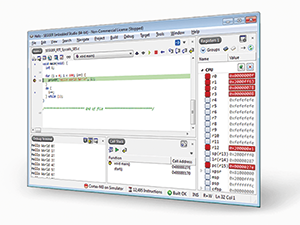
Embedded Studio is a complete, all-in-one solution for managing, building, testing and deploying embedded applications. With a Visual Studio-like appearance giving embedded engineers the same intuitive usage PC developers enjoy, it is an ideal solution for embedded C programming.
With Embedded Studio, developers get a powerful project generator for an easy start with common microcontrollers. Also included is a project manager, a source code editor, C/C++ compiler and integrated debugger.
Discover the J-Link ecosystem
J-Link doesn’t just support Segger’s own software, it also supports a host of third-party software which aids embedded system development.
GDB Support
J-Link can be used with GDB-based setups. The GNU Debugger (GBD) is the de facto debugger for development on Linux systems, however, it has now found its way into embedded development (even without Linux running on the target system).
GDB provides a standardised interface/API that can be used by an IDE. It also specifies a standardised protocol (GDB remote protocol) that allows GDB to communicate with a GDBServer which knows how to handle the debug probe connected to the target. The J-Link software package comes with the J-Link GDBServer which allows the use of J-Link in GDB-based setups.
LLDB support
J-Link can be used with LLDB. Originally, GNU toolchains provided GCC as a compiler and GDB as a debugger. Since Clang’s introduction as a compiler, LLDB was introduced (which was essentially a successor to GDB). In terms of protocol, it is backward compatible with GDB although the API for the IDE is slightly different.
The J-Link software package comes with the J-Link GDBServer, permitting the use of J-Link in LLDB-based setups.
OpenOCD support
J-Link can be used with OpenOCD (Open On-Chip Debugger). OpenOCD is an open-source software that can interface with virtually any debug probe. It provides a standardised API, allowing an IDE to support OpenOCD. There are several tutorials on the Internet that describe how to use J-Link with OpenOCD.
It is important to note that OpenOCD is third-party software, and as such, Segger cannot provide any guarantees. Using J-Link with OpenOCD bypasses all J-Link-specific features like Flash programming, unlimited Flash breakpoints and J-Link’s high debugging speed. OpenOCD handles J-Link as a simple sequence generator, which will affect debug performance. Using J-Link with OpenOCD is not covered by the standard J-Link support, but by the OpenOCD community.
Gain full insight with the J-Link Control Panel
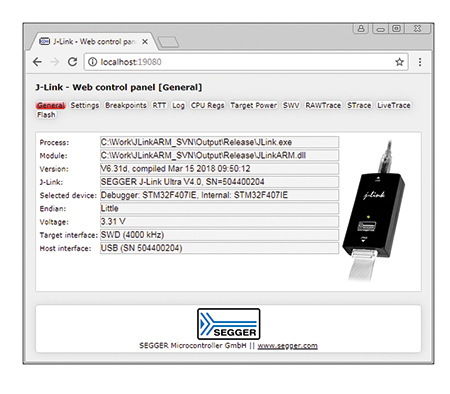
Eliminating any guesswork, the J-Link Control Panel provides full transparency about J-Link’s current activities. It is available on all platforms (Windows, Linux and macOS) with no additional utility required for installation. It is available through a standard web browser.
To demonstrate its utility, consider the following scenario: an IDE has been chosen and the developer has started working with it. Then, a new and useful feature is introduced to the J-Link software, but the IDE itself hasn’t adopted it yet, or even worse, the IDE cannot be updated due to certification reasons. This is where the J-Link Control Panel provides the opportunity to make use of new J-Link features, without even touching the IDE itself.
| Tel: | +27 11 608 0070 |
| Email: | [email protected] |
| www: | www.cstelectronics.co.za |
| Articles: | More information and articles about CST Electronics |


© Technews Publishing (Pty) Ltd | All Rights Reserved
 printer friendly version