MPLAB X Integrated Development Environment (IDE) is an expandable, highly configurable software program that incorporates powerful tools to help you discover, configure, develop, debug, and qualify embedded designs for most of Microchip’s microcontrollers and digital signal controllers.
MPLAB X IDE works seamlessly with the MPLAB development ecosystem of software and tools, many of which are completely free.
MPLAB X IDE brings a host of features to help you quickly debug your projects and minimise your development time. Some newer features include:
• Data Visualiser: No need to purchase extra visualisations tools since real-time streaming data can be viewed in Data Visualiser.
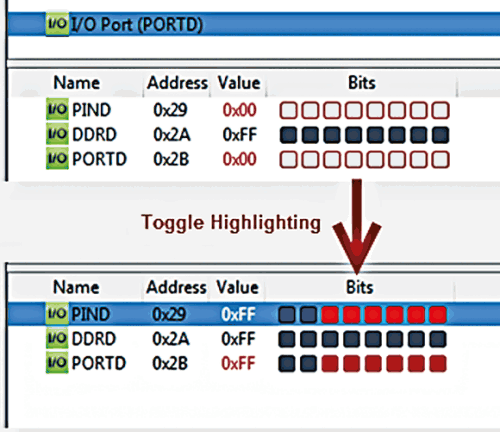
• I/O View: Pin states can be verified and manipulated with I/O View for fast hardware verification.
• Helpful Design Resources: Save time with useful links to software libraries, datasheets and user guides that are provided automatically.
• Easy to Use: Register and bit definitions are now just a click away.
• The MPLAB Integrated Programming Environment (IPE) for production-level programming is included.
I/O View
I/O View gives a register overview of the target device for the current project, serving as a quick reference during design. When debugging, a live view of the registers is displayed, and bits can be directly manipulated for fast hardware verification.

One-click access to data sheet content
The data sheet content as online context help can be directly accessed in a browser. When the Online Data Sheet button is active, it can be selected to get online context help for the selected register. The online data sheet is available for select MCU devices, including newer AVR, SAM and 8-bit PIC devices when a register is selected.
One-click make, program, debug/execute
Unlike other IDEs where you need to build, connect to the hardware tool, program the target and then start your debug session, all these functions are offered in one action button. Run, Program, or Debug Run starts ‘Make’, which will check for changes and build any relevant updates, connect to the tool, program the images, and either start a debug session or start an execution of the programmed image. If preferred however, one can choose to perform these functions individually.
Data Visualiser/Call Graph
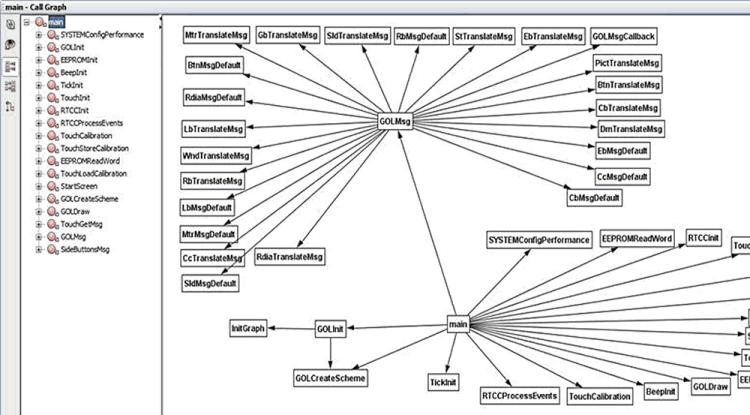
The Call Graph provides a static call tree of all functions called from other functions. It can also be exported to a Portable Network Graphics (PNG) image. This makes it easier to navigate your code or understand a colleague’s code.

Support for multiple versions of the same compiler
Multiple versions of a compiler can be installed simultaneously into the IDE. For any project, the specific version of one’s choice can be selected. This enables the use of more than one instance of a compiler within the IDE at the same time. Project configurations can be set to use an older version while trying a new release of a compiler.
Support for multiple debug tools of the same type
Multiple debug tools can be connected to the computer at the same time. Any tool desired for a specific project or configuration within a project can be selected, for example, the programmer and simulator can have their own configurations. More than one target can also be debugged at the same time using just one installation of MPLAB X IDE.
Live parsing
Live parsing will flag something that the C parser doesn’t recognise while typing in code, which frequently allows one to fix the code even before it is compiled.
Live code templates
Within the IDE there are many code templates that can be accessed using a simple find feature. Templates can easily be created, so that when values are entered into the template area, other areas of code are also populated.
Visit https://www.microchip.com/en-us/tools-resources/develop/mplab-x-ide to download the tool.
| Tel: | +27 11 236 1900 |
| Email: | [email protected] |
| www: | www.ebv.com |
| Articles: | More information and articles about EBV Electrolink |

© Technews Publishing (Pty) Ltd | All Rights Reserved