


This is the third and final part of the article which ran in the previous two issues of Dataweek.
Improving measurement performance through analyser features and signal processing
Modern spectrum and signal analysers have a number of features, options and alignment functions that can optimise performance in different measurement situations. Some are universal and part of all measurements, such as automatic alignments. Others are options, user-selected functions or user initiated operations. Several of the most useful examples are discussed here.
Choose whether to use a preamplifier, attenuator or both
A signal analyser will be most sensitive when 0 dB of input attenuation is selected. Sensitivity can be further enhanced by using an external or internal preamplifier, since a preamplifier with significant gain and low noise figure can substantially improve the analyser’s effective sensitivity or noise figure. Internal preamplifiers are not optimised for a particular measurement situation but offer convenience benefits and are included in the analyser calibration and alignments.
While preamplifiers generally offer the best sensitivity when combined with a 0 dB analyser attenuator setting, several accuracy, sensitivity and distortion trade-offs are involved when choosing input attenuation and pre-amplification. For example, with attenuation set to 0 dB, the signal under test is effectively coupled directly to the analyser’s first mixer.
The mixer’s input is not as close to a 50 Ω resistive impedance as the attenuator, and therefore the analyser’s reflection coefficient will be higher when no attenuation is used. This higher reflection coefficient will lead to a greater potential mismatch error when measurement sensitivity is maximised.
Use of the input attenuator will improve the analyser’s impedance match, with the match (and mismatch error) improving as attenuation is increased. Of course the disadvantage of using the attenuator is a loss of sensitivity. One dB of sensitivity is lost for each dB of input attenuation.
The analyser’s built-in preamplifier, if available, may allow both sensitivity and mismatch error to be optimised. With the preamplifier providing a fixed gain following the input attenuator, the attenuation can be increased to a value that provides adequate sensitivity while improving reflection coefficient. This will reduce potential amplitude accuracy errors due to mismatch.
Alternative input paths to optimise sensitivity versus distortion and other parameters
Some general improvements in the functionality and reliability of spectrum analysers can cause the analyser noise figure or displayed average noise level (DANL) to be slightly degraded. Examples would include the switching and path losses needed to implement an internal microwave preamplifier, and the associated switching for low-band (non harmonically-mixed) operation and a low-band preamplifier.
Another example (in the Agilent PXA for example) is the change to solid-state input switching in some cases, to improve reliability and repeatability. Solid-state switches typically have slightly higher insertion loss than hardware switches at microwave frequencies. The switching and path losses increase with frequency and while they can be characterised and corrected to preserve amplitude accuracy, they still affect the noise floor of the analyser and thus the accuracy of low-level signal measurements.
Preamplifiers can compensate for this loss and improve signal/noise for small signals, generally offering the best DANL or noise figure throughout the microwave and millimetre frequency ranges. However they are generally limited to measurements when no large signals are present at the analyser input. Large signals can exercise nonlinearities in the preamplifier, creating distortion products that can be mistaken for those from the signal under test. These large signals can cause distortion problems even when outside the selected frequency span.
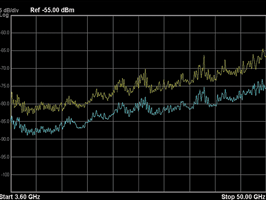
In the Agilent PXA this problem is solved through an optional low-noise path which uses hardware switches to bypass lossy elements normally found in the input chain. The result is the highest sensitivity possible without a preamplifier, and a measurement configuration suitable for situations when larger signals are present. The low-noise path applies to all ‘high-band’ frequencies of 3,6 GHz and higher, and an example of the improvement in noise floor is shown in Figure 8.
Signal processing to subtract analyser noise power
An analyser’s own noise floor is a limiting factor in some measurements, and the conversion loss from harmonic mixing causes this noise floor to increase with frequency. Noise limits the low end of dynamic range, along with the accuracy of measurements on small signals.
When large signals are present, it is common to increase analyser attenuation as a way to limit distortion due to overload, but this brings small signals closer to the analyser’s own noise, and thus the analyser noise limits the amount of attenuation. Noise can also have a large impact on measurement speed, potentially requiring narrower RBWs (resolution bandwidths) for measurements such as spur searches, since these narrow RBWs require slower sweeps due to increased RBW settling time.
As a result, reducing the analyser’s contribution to noise power in a measurement can help both low-level and high-level measurements.
Alternatively it can allow low-level measurements to be made without the cost and potential distortion contributions of a preamplifier.
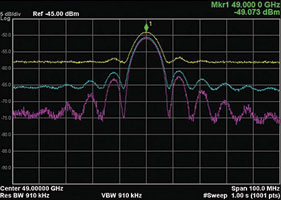
A standard, user-selectable feature in Agilent PXA analysers is noise floor extension (NFE). This feature automatically performs a scalar subtraction of the analyser’s noise power from spectrum measurements. The PXA combines real-time measurement processing with a built-in model of analyser noise power (noise floor) for all measurement configurations.
Thus the analyser can subtract the majority of its noise power contribution to measurements without the convenience penalty of a separate noise floor measurement. There is no effect on measurement speed and the benefit is available for all frequencies the analyser covers. An example of the improvements from noise floor extension and low noise path is shown in Figure 9.
Bypassing the preselector
As mentioned previously, some microwave and millimetre frequency signal analysers include a microwave preselector bypass option. This bypass path removes the tuneable preselector filter from the measurement path and is essential for wide bandwidth measurements.
The dynamic range benefits and costs of bypassing the preselector depend on the individual measurement specifics. While bypassing the preselector removes its insertion loss contribution it also removes some amount of wideband noise filtering. The effect on analyser noise figure should be evaluated on a case-by-case basis if noise is a concern. Bypassing the preselector can also allow mixer images and other signals into the final IF for measurement. If there is confusion in signal identification, one can tune to the desired signal with the preselector present and then bypass the preselector for final measurements.
Alignments to optimise analyser performance
Periodic alignments are an important element in the performance of microwave and millimetre signal analysers. The alignments are performed automatically according to time and temperature parameters monitored by the instrument itself. In some situations these alignments are inhibited by the user to prevent them interrupting signal measurements. In these cases the user is responsible for initiating alignments when allowable.
In general, the best measurements are made when the analyser temperature has stabilised and a calibration or alignment is performed shortly before the measurement itself.
Preselector alignment or centring
The (typically YIG-tuned) filters that serve as preselectors in most millimetre-wave spectrum analysers run in an open-loop mode, and are therefore prone to some degree of drift. The preselector centring operation is thus an important one and should be performed when the centre frequency is changed. Though the analyser itself performs the centring, the operator must initiate the process before a final measurement is made.
Preselector tuning is an operation where the analyser optimises the overall tuning para-meters for the preselector over the analyser’s full operating range, and need not be done often.
New research on mismatch error calculations yields tighter accuracy specifications
Estimating and optimising measurement accuracy is a particular challenge for microwave and millimetre measurements. Major performance figures such as amplitude and frequency accuracy (or phase noise), flatness, noise level (or signal/noise) and repeatability degrade as frequency increases. Analyser architectural changes such as the use of higher-order harmonics tend to widen the inherent bandwidth of measurements and reduce sensitivity.
Cabling and connectors contribute to both signal loss and flatness variations due to impedance or return loss uncertainty. These sources of error add to those from any uncertainties produced by the imperfect impedance of the source under test.
Understanding power measurement accuracy or uncertainty at microwave and millimetre frequencies is somewhat complex, and automated calculations are available to simplify the task.
Mismatch uncertainty is a particularly important parameter, and is often the largest component of amplitude measurement uncertainty. Newly published research from Agilent Technologies provides a better understanding of the accuracy effects of mismatch uncertainty.
In the past this uncertainty has been modelled in several different ways, which overestimated the magnitude of the error due to mismatch. A new statistical method using a Rayleigh distribution has been validated by experimental evidence to more accurately estimate mismatch error. Importantly, the method reduces the error contribution due to mismatch to between one third and one sixth of its previous value.
This new method applies in the common scalar analyser case where reflection coefficient phase is not known, and reflection coefficient magnitude must be assumed from manufacturer data across a wide range of frequencies. Complete information and a link to an uncertainty calculator program is available in Agilent application note 1449-3 ‘Power Measurement Uncertainty per International Guidelines,’ as updated April 2011.
| Tel: | +27 12 678 9200 |
| Email: | [email protected] |
| www: | www.concilium.co.za |
| Articles: | More information and articles about Concilium Technologies |


© Technews Publishing (Pty) Ltd | All Rights Reserved
 printer friendly version