


The digital multimeter (DMM) is a virtually ubiquitous fixture on electronic engineers’ workbenches, thanks to its ability to measure a number of electrical characteristics.
Sophisticated capabilities in Agilent Technologies’ DMM products extend this functionality even further, beyond what has traditionally been considered the realm of the DMM.
Simplified digitising
Agilent’s higher-end DMMs have higher precision, data logging capability and higher measurement speeds, enabling them to be used to digitise signals. Digitising is useful to understand a signal better, and the data can be plotted for a visual representation of a signal.
Digitising uses fast sampling techniques to allow one to analyse transients, non-repetitive signals and other AC waveforms in the time and frequency domains. Historically, DMMs were set up to make discrete measurements with varying sample intervals. However, newer DMMs have deterministic sample intervals and sampling models that allow for digitising a signal.
DMMs are flexible, have up to 22 bits of resolution, and are relatively inexpensive. The DMM has the added advantage of being able to digitise resistance, current and temperature straight out of the box.
Digitising with a DMM has been simplified with the Agilent DMM Connectivity Utility. This software app can graph measurements in a couple of clicks, and also synchronises multiple DMMs and allows users to put together a multichannel DMM system.
The PC DMM app can communicate to these DMMs over GPIB, USB or LAN, and allows the use of the same intuitive interface to set up digitising for those DMMs. It presents the DMMs as bench tiles on a computer screen, and can be used to visualise signals on up to four different DMMs at the same time. The application allows control and measurement with up to nine DMMs.
The app has a trend chart mode that displays data across time, allowing for a quick understanding of measurement peaks, noise or drift. Similar to an oscilloscope, this mode features measurement markers that allow analysis of the measurement between the markers. Customisable features such as autoscale, zoom and trace colour allow users to modify their view of the data. They can also annotate measurement events with in-program notes.
Once the measurements are completed, the data can be exported into a variety of formats, including Microsoft Excel, Microsoft Word, MATLAB and .csv. The export menu also enables a quick screen capture; exported data includes time stamps of when measurements were taken.
The software provides access to trigger menus, in-program limit testing options and sample interval settings. New functionality allows the user to set up the app to email them when a measurement exceeds a limit. Using this mode enables visualisation of live data as the measurements are taken.
The app also keeps track of data from past sessions, which is stored in a file on the PC and can be managed like other PC files. Past data sessions can be opened and the same DMM tools can be used to analyse the data as if it had just been acquired. This capability can also be used to transfer groups of measurements to another PC, where they can be viewed in the familiar Agilent DMM application.
Viewing graphical results
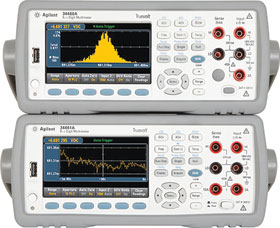
The new Agilent 34461A offers a way to get insight into measurement data without transferring it to a PC. The DMM features a large graphical display and built-in math functions that show measurement trends, statistics and histograms.
For those occasions when just a quick qualitative glance at a measurement is required to be assured that the test is proceeding as planned, the bar meter display is ideal for showing an analog indication of the value in addition to the digital readout. The bar meter can also be enhanced with a limits function in the to provide an even more informative display.
The trend chart display on the 34461A can be set to display the most recent data over the last minute, or all the data collected since the last time the readings were cleared. This could be used to, for example, monitor a power supply design under changing loads.
In this way, multiple DMMs could be set up to monitor the output voltage, load current and various temperature points inside the unit. As the load current is varied, once could see the change in voltage and temperature as a function of time.
When the lowest digits of a reading are changing constantly, it is important to know the nature of that variation. The average, distribution shape and standard deviation are all critical information for understanding the variation phenomena. The instrument’s histogram view provides insight by showing the distribution of the measured values.
The 34461A also provides math functions such as setting null values, dB/dBm scaling, statistical data, min/max and limits.
| Tel: | +27 12 678 9200 |
| Email: | [email protected] |
| www: | www.concilium.co.za |
| Articles: | More information and articles about Concilium Technologies |


© Technews Publishing (Pty) Ltd | All Rights Reserved
 printer friendly version