


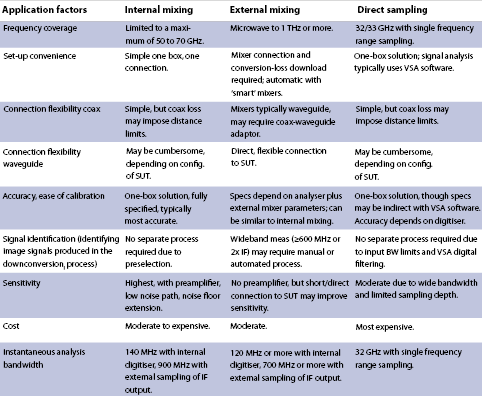
Part 1 of this article, which ran in the previous issue of Dataweek, compared methods of signal measuring in micro- and millimetre-wave signal analysis. Table 1 summarises the findamental differences between these approaches.
Choosing solutions for wideband analysis
Traditional spectrum measurements require a maximum analyser IF bandwidth similar to or wider than the widest resolution bandwidth to be used. Other measurement types such as pulse analysis and demodulation may require considerably wider IF bandwidths and compatible signal sampling capability.
One-box signal analyser solutions
Spectrum and signal analyser IF and sampling bandwidths have been increasing along with the signals they are used to measure. 25 and 40 MHz bandwidths are readily available, and the widest bandwidths are now 140 MHz or higher in analysers such as the Agilent PXA. IF digitisers in modern signal analysers are combined with all-digital IF processing to provide a complete range of spectrum and other signal measurements for in-band and out-of-band measurements.
Many integrated one-box solutions such as the Agilent X-Series analysers also support a range of measurement applications such as phase noise and channel power, along with applications tailored to modern communications standards. The X-Series analysers can also host the Agilent 89600 vector signal analysis (VSA) software for a wide range of vector and demodulation measurements, including the newest ones available to support emerging communications standards.
Preselectors in microwave and millimetre signal analysers are wider than the widest resolution bandwidths and are configured to track the analyser centre frequency for traditional spectrum measurements. However, for analysis of wideband signals it may be important to remove preselector filtering from the signal path. This is accomplished through a preselector bypass capability (often optional) that is activated from the front panel or remotely.
With their combination of convenience, available software solutions and high-resolution, wide-bandwidth digitisers, today’s signal analysers are often the best choice for all kinds of analysis of wideband signals. Alternative choices (such as those described below) are most often considered when signal analyser bandwidth is insufficient.
Signal analysers as wideband down-converters
Some spectrum and signal analysers such as the Agilent PXA can also be used as tuneable down-converters and/or detectors at microwave and millimetre frequencies. The PXA provides a variety of IF and video outputs, including a fast log video output (rise time as fast as 14 nanoseconds) for time-based analysis of pulses such as radar and EW.
With an IF bandwidth up to 900 MHz (much wider than its maximum digitising bandwidth) the PXA can be used with wideband digitisers in a down-converting configuration, as shown in Figure 3. Signal analysis can be performed inside a digitiser such as the Agilent Infiniium oscilloscopes by the Agilent 89600 VSA software.
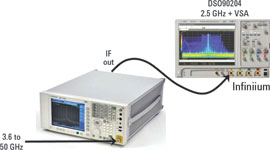
Oscilloscopes and other wideband digitisers generally do not have equivalent performance (dynamic range, linearity, number of equivalent bits) to the internal digitisers in signal analysers. Distortion measures may be approximately 40 to 45 dB rather than the 75 to 80 dB of internal digitisers. This makes these external digitisers well suited for in-band measurements such as modulation quality and pulse parameters of wideband signals. Out-of-band measurements can then be made using the normal spectrum analysis capabilities of the signal analyser.
Dedicated up-converters and down-converters
Some ultra-wideband signals (typically in the millimetre frequency range) call for a combination of bandwidth, sensitivity and operating frequency that is not available from signal analysers operating directly or as down-converters. Modulation bandwidths reach 2 GHz or more, greatly narrowing the range of solutions.
Dedicated up-converters and down-converters are available on a special order basis from Agilent to satisfy these needs. To provide adequate performance the solutions are customised rather than offered as an off-the-shelf product. These dedicated converters provide high sensitivity (low conversion loss) for applications where no external connector is available and therefore connections must be made through an antenna. This sensitivity is combined with the very wide bandwidth required for ultra wideband applications.
The dedicated down-converters have a number of limitations including limited frequency operating range. Instead they are generally customised for the operating frequency of a specific application. They are not preselected and are therefore not optimised for out-of-band measurements such as spurious. These millimetre down-converters are not integrated solutions and require separate local oscillators.
The output of these millimetre down-converters is then sampled by a wideband digitiser, typically an oscilloscope. Spectrum measurements and demodulation are then performed by software such as the Agilent 89600 VSA.
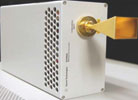
An example of a dedicated down-converter is shown in Figure 4. This millimetre down-converter has a waveguide input and in the figure it is equipped with a horn antenna for close-range analysis of a signal that is not available from a waveguide or coaxial connector.
Coaxial versus waveguide connections
Signal and spectrum analysers generally provide coaxial connectors for the SUT, and these connectors are chosen for compatibility with the highest frequency covered by the analyser. The ready availability of coaxial-to-waveguide transitions, plus the potential use of external mixers (usually with waveguide SUT inputs) means that the user has choices to make in the method of signal connection.
A waveguide is usually implemented as a hollow rigid metal structure with a precision rectangular interior whose cross section is of the proportions 2:1. Its operating frequency covers about one octave and dimensions get smaller as operating frequency increases. A waveguide is operated with a single mode of propagation.
The ‘cutoff’ frequency is the minimum frequency of the desired propagation mode, and the waveguide behaves like a high-pass filter around this cutoff frequency. Above the normal operating frequency range, multiple modes of propagation are possible, each with different transmission characteristics.
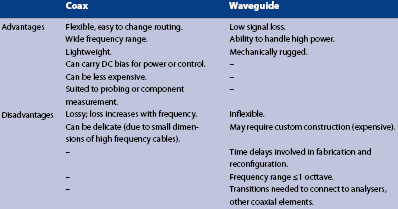
Both coaxial and waveguide connections have significant benefits and drawbacks. In particular, waveguide is often chosen when there is a requirement for high power handling or lowest signal loss. For higher millimetre frequencies and into the terahertz region it may be the only practical choice. Table 2 summarises the advantages and disadvantages of these connection methods.
Choosing and using the appropriate cables and connectors
Cables, connectors and adaptors
Accurate and consistent measurements depend on the use of cables and adaptors designed for the frequencies involved. Their materials, structures and geometries are specially designed for a specific operating frequency range, to yield consistent impedance and reduce signal loss. Avoid compromising the performance of an expensive test system with poor quality or inappropriate cabling and accessories.
Since most millimetre-wave spectrum analysers are used in an environment that also includes work at lower frequencies, it can be tempting to use hardware designed for these lower frequencies. However, smaller wavelengths demand smaller dimensions in the cables and connectors.
To avoid a phenomenon called ‘moding’ (excitation of the first circular waveguide propagation mode in the coaxial structure) the diameter of coaxial connectors and cables must be much smaller than the signal wavelength. For millimetre-wave measurements, this means that common SMA and precision
3,5 mm accessories should not be used. Figure 5 shows a comparison of the insertion loss of SMA and 2,4 mm assemblies over the frequency range of 30 to 50 GHz.
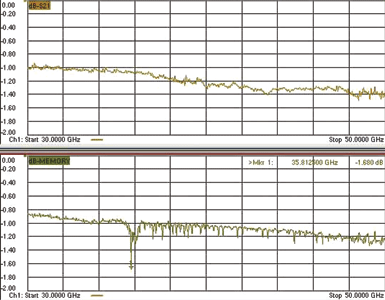
It is interesting to note in the measurements of Figure 5 that the insertion loss of the SMA assembly is usually slightly lower than the 2,4 mm assembly, but is much less consistent. The insertion loss peak just below 36 GHz is significant, very narrowband and would be inconsistent in its frequency, amplitude and phase. This would be a troublesome problem for any measurements in this frequency range. For example, the amplitude and phase inconsistencies of this insertion loss peak would distort any modulated signal that it coincided with.
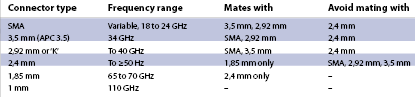
A summary of common microwave and millimetre connectors, their frequency ranges and permissible intermating is provided in Table 3.
One may consider using 2,92 mm equipment for frequencies to 40 GHz, and take advantage of the fact that 2,92 mm connectors intermate with SMA and 3,5 mm for a degree of flexibility and compatibility when lower-frequency measurements are made. However, for best performance and repeatability to 50 GHz, precision 2,4 mm accessories are recommended.
For mixed-frequency environments, one may want to standardise on 2,4 mm accessories, using between-series adaptors to make connections where needed. Though they have slightly more insertion loss than SMA and 3,5 mm (primarily above 30 GHz), 2,4 mm accessories can be used to cover all lower frequencies and offer superior repeatability.
Especially at millimetre frequencies, it is important to consider the insertion loss of cables and adaptors. As described later in this article, a single adaptor may have insertion loss of 0,5 to 1 dB at frequencies approaching 50 GHz. For the most accurate measurements, this loss should be accounted for and measured if possible, since analysers are, by necessity, specified at their front panel connectors, without adaptors.
Connector torque
Using the appropriate torque wrench ensures proper connector torque, improving measurement repeatability and extending connector life. Though the metal bodies of connectors and adaptors may seem perfectly rigid, there is always a small amount of flexibility in these structures. The short wavelength of very high-frequency signals makes measurements of them more sensitive to this flexing.
Repeatable measurements require consistent torque from measurement to measurement and on all the connections in a setup. A torque wrench also avoids damage due to over-tightening and helps connectors achieve their rated lifetimes. The small dimensions of high-frequency connection structures means that they do not have great mechanical strength, and may be deformed or even permanently damaged by excessive torque.
Two common torque values handle most measurements below 70 GHz. They are 90 N-cm for 2,4 mm, 1,85 mm and precision 3,5 mm connectors; and 56 N-cm for SMA connectors. Torque wrenches are available preset to these torque values.
SMA connectors are frequently used in combination with 3,5 mm and/or 2,92 mm connectors due to their ability to be intermated. In this situation the proper torque for these intermating operations depends on the gender of the male connector. Thus a 56 N-cm torque wrench should be used when connecting male SMA connectors to either 3,5 mm or 2,92 mm (K) connectors or to other SMA connectors, while a 90 N-cm torque wrench should be used when connecting male 3,5 mm or male 2,92 mm connectors to mating female connectors including SMA.
Note: When making connections, take care to rotate only the nut, and never rotate the body of the connectors when their mating surfaces are in contact. Use another wrench on the flats of one connector to prevent rotation.
The difference made by proper torque can be only a fraction of a dB for a single connection, but the errors or loss from multiple connections can add to become significant considering the high accuracy of today’s analysers and the accuracy expected of modern measurements. Good accuracy at millimetre-wave frequencies is a challenge, and proper torque eliminates one source of additional error.
Connection consistency
Wherever possible, use the same cables, connectors and cable routing for the most consistent measurement results. Even the highest quality cables and adaptors have measurable insertion loss and affect impedance (return loss). These effects generally increase with frequency.
The smaller dimensions of millimetre-wave cables and hardware prevent amplitude dropouts due to moding, but contribute to signal loss. This loss can be more than 3 dB per metre of coaxial cable (not counting connectors) and more than 0,5 dB per adaptor or connector pair at 40 GHz. Even in situations where comparable connection length is maintained, different cable/connector combinations with the same end-to-end gender can result in different insertion loss and return loss.
The situation is similar when using different types or brands of cables, and even when comparing good cables to those that might be worn or damaged. Bending, kinking and stretching cables can also affect results – in some measurements you can see a difference in real-time just by flexing a cable while a measurement is in progress.
Since repeatability is as important as absolute accuracy in many measurements (especially where some sort of substitution may be used to improve accuracy), it is always a good idea to use the same cables and connectors in the same configuration from measurement to measurement. Not surprisingly, the use of semi-rigid coaxial cable can improve many measurements by reducing incidental movement and making more consistent connections.
Connect the analyser to the circuit using the shortest, simplest, straightest path possible. Fewer connectors or adaptors, and shorter cables, reduce the chance for problems and minimise the non-ideal behaviour of each element. Cables should not be so short, however, that they are kinked or bent over a radius tighter than recommended by the manufacturer. Sharp bends will cause physical discontinuities which result in localised impedance problems, and can permanently damage cables or mechanically distort the cable-connector interface.
When different connections are being made between measurements, and especially for relative measurements, it is important to understand the measurement plane. For this, it is key to know what parts of the measurement connection change from measurement to measurement.
Electrical and mechanical damage hazards
Electrical damage
Electrical damage is a particular concern for analyser inputs that use high-frequency components and assemblies that are physically small and cannot dissipate significant power or withstand high voltages.
The problem is more acute at millimetre frequencies because protective measures such as a DC block are not automatically included due to their effect on analyser performance. If the SUT has a DC component, a DC block should be added by the user, perhaps as part of a ‘connector saver’ assembly as described below.
ESD is a significant concern at high frequencies, as the small size of microwave and millimetre components makes them more vulnerable. Typical ESD precautions include using table mats, wrist and heel straps, and ensuring a proper ground connection for the analyser.
Some signal sources can pose a special hazard even when producing low power, due to their production of much larger transients during switching. If this is a concern, one mitigation technique is to switch to higher levels of analyser input attenuation when making source changes or connections.
A special frustration with electrical damage is that the resulting performance degradation may not be complete or obvious. Some damage will impair analyser performance in a significant but non-obvious way.
Mechanical damage
The small and precise dimensions of microwave connectors also make them subject to expensive mechanical damage. Unfortunately, some degree of damage and a certain amount of wear are inevitable after many connect/disconnect cycles.
One practical solution is to protect the analyser’s front-panel connector by making external connections through a sacrificial adaptor called a connector saver. A typical connector saver at these frequencies is a 2,4 mm adaptor with female connectors at both ends, and that is why millimetre-wave spectrum analysers often have male connectors on their front panels.
In addition, the male connector is more durable and less likely to be damaged by attempted mating with an incompatible connector type or damaged connector. The connector saver is usually left in place on the front of the analyser, with frequent connections made to it instead of the analyser’s permanent connector. This dramatically reduces the number of connect/disconnect cycles that the analyser’s connector experiences, and can put off the need for comparatively expensive replacement of the analyser’s connector (and associated recalibration) nearly indefinitely. Several examples of adaptors as connector savers are shown in Figure 6.
In a mixed environment of 2,4 mm (or 1,85 mm) connectors and SMA connectors, a special intermating damage hazard exists. The SMA connector is mechanically similar to the 2,4 mm or 1,85 mm connector, and intermating of a male SMA connector is prevented only by the fact that the SMA nut is too small to be threaded to the higher-frequency connector. The protection provided by this size difference is lost if the SMA nut is not captive and is allowed to slide away from the other parts of the connector. This hazard is shown pictorially in Figure 7.
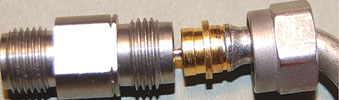
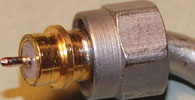
The SMA male connector in these pictures has a non-captive nut, allowing it to be inserted into the smaller collet of the 2,4 mm female connector, causing damage. The situation is the same for 1,85 mm connectors. Note that the thread pitch and end relief distance are different on the 2,4 mm and 3,5 mm ends of the adaptors.
This article will be continued in the next edition of Dataweek.
| Tel: | +27 12 678 9200 |
| Email: | info@concilium.co.za |
| www: | www.concilium.co.za |
| Articles: | More information and articles about Concilium Technologies |


© Technews Publishing (Pty) Ltd | All Rights Reserved
 printer friendly version