


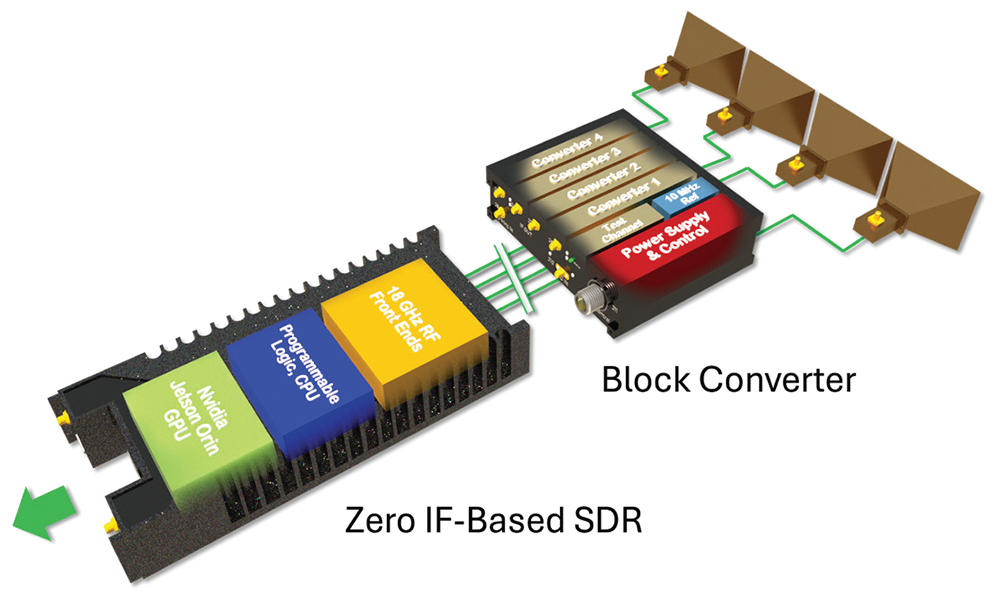
Software Defined Radios (SDRs) have become ubiquitous in applications that value their flexibility, reconfigurability, spectrum agility and upgradability. These include defence, public safety, wireless infrastructure, space, SATCOM, test and measurement to name a few. However, there are several common methods of implementing SDR architectures – how do you know which is best to meet a specific need? In this paper we will look at some common architectures, their pros and cons, and their likely development trajectories given the levels of investment being poured into them.
Why should I care which SDR architecture was chosen?
When deciding on the best approach to solving a particular RF challenge, there tend to be two competing, orthogonal inputs – Function and Form. Put another way, they can be thought of as desired capabilities and forced constraints, as illustrated in Figure 1. They are met with differing degrees of success by the architecture chosen depending on the balance between them and frequently may be met by multiple approaches.
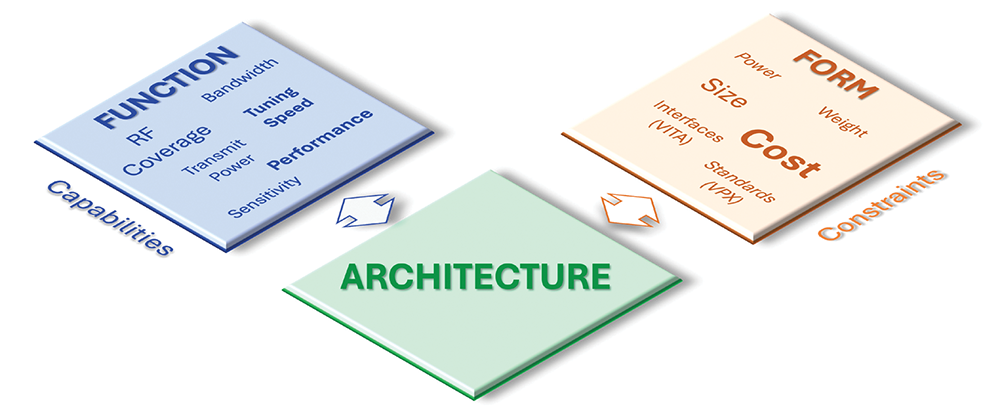 Figure 1. Architecture links the orthogonal axes of desired capabilities and forced constraints.
Common architectures include the following:
1. Superheterodyne, also known as Superhets, Heterodyne, or 2-Stage Heterodyne.
2. Block Converter, also known as Downconverters/ Upconverters, or 1-Stage Heterodyne.
3. Direct Sampling, which is sometimes called Direct RF, or Direct RF sampling.
4. Zero IF, also referred to as ZIF, Homodyne, confusingly Direct Conversion, or in some contexts, RFIC.
5. Combined Architectures, which usually involves adding a block converter in front of one of the others.
Simplified representations are shown in Figure 2. A few notes:
• For simplicity we are showing the receive side of the signal chain, but the transmit is similar in reverse.
• We do not plan to discuss these in detail as we are focusing on relative trade-offs for particular applications in this paper – more in-depth reading can be found in the References section at the end.
• For the record, we employ all these architectures and use each of them in particular products that make best use of their advantages, and we engineer around their disadvantages for a given application.
• Super Het and Block Converters require more investment in RF engineering skills, whereas the higher numbered items require a similarly heavy investment, but on the digital/ DSP side.
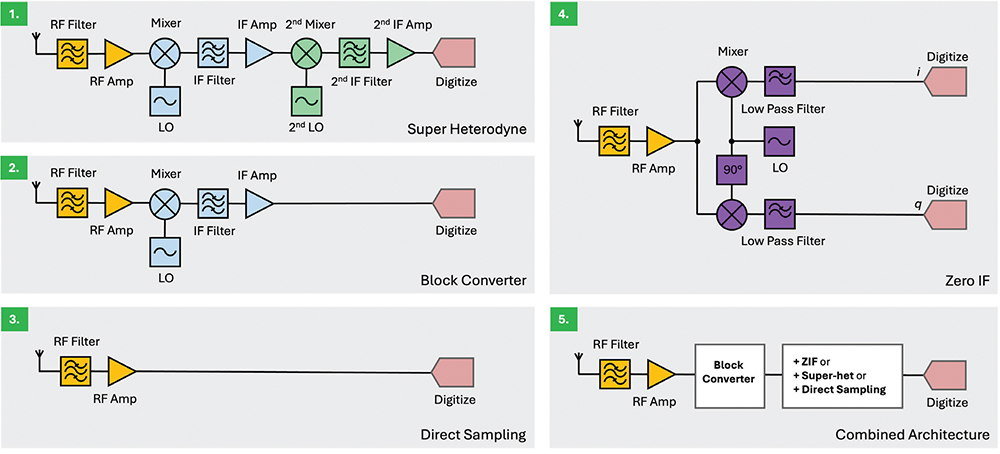 Figure 2. Five typical SDR architectures.
How do we assess RF architectures?
For this exercise we have boiled down the two axes of function and form into the following for simplicity.
RF function, or capabilities
• RF Coverage – gap-less frequency range that a radio can be tuned to. On the high end, 6 GHz is often available, although for some applications much higher is highly desirable.
• Bandwidth – Once tuned to a specific frequency, the width of the frequency band that can be passed through the analogue components unattenuated and then digitised at a sufficient sample rate. Example: 100 MHz.
• Performance – spurious-free dynamic range (SFDR) is used as the primary figure of merit for system performance in this article, though key performance indicators vary depending on application (e.g., see Reference 1).
• Selectivity – for many radio applications, having great performance is meaningless if the environment it operates in causes the performance to break down. Selectivity specifies how well RF noise outside the frequency band of interest is attenuated.
Form, or constraints
If the radio can be infinitely large, infinitely expensive, and be supplied with infinite power, great performance is easy, but this is obviously wholly unrealistic. The parameters are therefore:
• Size, Weight and Power (SWaP) – smaller is better for each.
• Reconfigurability – How easy is it to adapt the design to a different use? Frequency band? IBW?
• Industry investment – we thought it would be interesting to see which architectures are seeing increased investment, deployment, and capabilities for applications such as 5G and automotive radar vs. those that are more niche, as this impacts where to place development effort that will pay off in the future.
For Function and Form we kept things simple and used a 3-point scale of Poor, Good, and Best, as this was sufficient to tease out key differences between each.
To read the full paper, visit www.dataweek.co.za/ex/feb26-epiq.pdf
| Tel: | +27 12 667 5212 |
| Email: | [email protected] |
| www: | www.rfibersolutions.com |
| Articles: | More information and articles about RFiber Solutions |


© Technews Publishing (Pty) Ltd | All Rights Reserved
 printer friendly version