


Output power measurement is one of the basic measurements for a radar system as it determines the performance, range and resolution of the system. The most common output power measurements are pulse power, pulse repetition interval, pulse width, and rise and fall times.
Because the signal rise and fall times determine the system bandwidth and affect the detection and identification of targets, the rise and fall time measurement in a radar system has to be meticulously performed to ensure the measurement is accurate and repeatable.
This article provides four useful tips for making accurate and repeatable rise and fall time measurements for radar signals using RF and microwave power meters.
Tip 1: Set the right reference levels
It is important to define what rise and fall time measurements are to make these measurements accurately. According to IEEE STD-181-2011, the standard for transition, pulses and related waveforms, the term ‘rise and fall time’ has been replaced by ‘transition duration measurement, positive and negative’. Transition duration is defined as ‘the difference between two reference level instants of the same transition. Unless otherwise specified, the two reference levels are the 10% and 90% reference levels’.
The standard 10%, 50% and 90% reference levels are commonly used to define rise time, fall time, pulse width and pulse duration. However, you may also frequently hear about the 1%, 25% and 81% reference levels. What is the relationship between the two sets of reference levels, and which one should you use?
The standard 10%, 50% and 90% reference levels are commonly used for power waveforms. However, most of the timing in a radar system, such as the time between control pulses, is derived in the voltage domain for the time between control pulses. Since power is proportional to voltage squared, the 10%, 50% and 90% reference levels in the voltage domain should be scaled accordingly and this is mapped to 1%, 25% and 81% in the power waveform.
Therefore, to obtain accurate rise time, fall time and pulse width measurements, you should set the right reference levels based on whether the timing of the radar system is derived in the voltage or power domain.
IEEE STD-181-2011 defines the algorithm that can be used to determine the reference levels as illustrated in Figure 1.
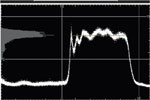
1. Generate a histogram from the waveform using a number of equally-spaced bins between the maximum and minimum values from the waveform;
2. Split the bi-modal distribution into two sub-histograms (in Figure 1, only the top part of the histogram is shown);
3. The reference levels are determined by selecting the mean or mode of the sub-histograms.
The Agilent P-Series N1911A/N1912A power meter and U2020 X-Series USB peak and average power sensors utilise the mode of histogram algorithm to establish the 0% and 100% reference levels for accurate pulse parameter measurements. The default reference levels used for rise/fall time and pulse width measurements are 10%, 50% and 90% of the pulse top. Both families of power meters also allow users to adjust the reference level to 1%, 25% and 81% (or any other values) for radar systems derived in the voltage domain.
Tip 2: Ensure the instrument noise floor is at least 20 dB below the signal pulse top
It is also common to look at power waveforms with dB scaling. Here, the 1%, 25% and 81% reference levels are mapped to -20 dB, -6 dB and -0,1 dB, while the 10%, 50% and 90% reference levels are mapped to -10 dB, -3 dB and
-0,05 dB, both relative to the 100% reference level expressed in dBm.
Seeing these numbers expressed in dB makes it apparent that the instrument noise floor must be at least 20 dB below the signal pulse top in order for it to compute the 1% to 81% rise and fall time measurements accurately.
Tip 3: Capture the entire rising edge or falling edge
As a power meter user, you may obtain different rise and fall time measurements when using different scale settings. You may wonder which reading is accurate. The following section explains this scenario and describes how to identify accurate readings.
Let us take an example of rise time measurement using an U2021XA X-Series USB peak and average power sensor and an ESG signal source. When you set a different time scale, the power sensor reports different rise time measurements, as shown in Table 1.
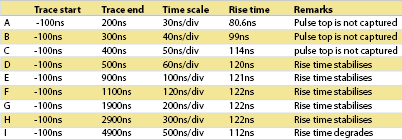
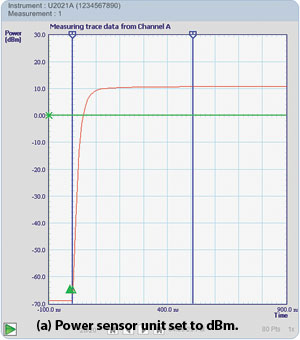
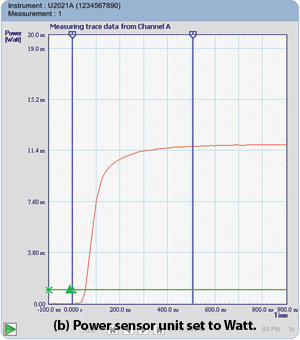
Do you know why? The differences occur because the ESG takes about 500 ns to get from -3 dB to its pulse top (refer to Figure 2b). You can easily observe this behaviour by changing the power sensor unit from dB to Watt. From Table 1, you can see that the rise time measurement starts to stabilise when the time scale setting reaches 60 ns/div, which allows the power sensor to capture the entire rising edge up to its pulse top at 500 ns (when trace end is set to 500 ns).
As long as the time scale setting is long enough for the power sensor to capture the pulse top level, the power sensor will be able to provide consistent rise time measurements. However, if the time scale is set to too long an interval, the resolution worsens and the measurement accuracy will begin to degrade – refer to row I of Table 1.
Hence, to obtain accurate and consistent rise time measurement, the rule of thumb is to set the power sensor time scale to zoom into the rising edge of the pulse and ensure that the power sensor captures the pulse top level (or the 100% reference level). The same principle applies to fall time measurements. Set the power sensor time scale to zoom into the falling edge of the pulse and check that the start time of the trace captures the pulse top level before it starts to descend.
Tip 4: Use an instrument with a system rise time that is faster than the signal rise time
When trying to measure a radar pulse signal with very fast rise/fall time, it is important to use an instrument with a system rise/fall time faster than the expected signal rise/fall time. To further reduce measurement uncertainty, it is recommended to measure the RF pulse from the device under test (DUT) directly without using adapters or converters.
Figure 3 shows the rise time measurement error (in percentage) of an Agilent U2020 X-Series USB peak and average power sensors versus the DUT’s actual rise time. Please note that with the 13 ns system rise time of the X-Series sensors, the measured error of signal with 13 ns rise time is at 41%. The X-Series sensors can comfortably measure a signal rise time of more than 30 ns accurately with error of less than 10%.
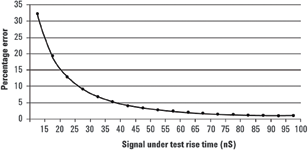
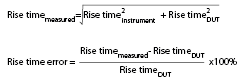
This graph is constructed based on the following error equation:
Conclusion
It is not difficult to achieve accurate and consistent rise and fall time measurements as long as you select the proper instrument and set it up correctly.
First of all, you should set the right reference levels depending on whether the pulsed signal is generated under the voltage or power domain. Secondly, ensure that the instrument noise floor is at least 20 dB below the signal pulse top to ensure that you capture the 1% to 81% reference level. Thirdly, capture the entire rising edge or falling edge.
Finally, make sure that the instrument system rise time is sufficient to measure the signal rise time accurately. With a 13 ns rise time performance, user configurable reference levels, wide peak power dynamic range and a compact, portable form factor, the new Agilent U2020 X-Series USB peak and average power sensors are ideal instruments for your radar pulse measurements.
| Tel: | +27 12 678 9200 |
| Email: | [email protected] |
| www: | www.concilium.co.za |
| Articles: | More information and articles about Concilium Technologies |


© Technews Publishing (Pty) Ltd | All Rights Reserved
 printer friendly version