


Emulation builds confidence in hardware bit by bit and lets the software design begin earlier. The good news: you just received your target DSP board from the assembly shop. The bad news: now you have to debug it.
Where do you begin? Start with a little common sense and let a JTAG emulator take you the rest of the way. That duo will allow you to bring up the target platform and give you the confidence you need to allow software development to begin on the target.
JTAG is a standard method of boundary-scan testing established by the European-based Joint Test Action Group and the IEEE, which named it IEEE Standard 1149.1. The standard defines a serial interface for the I/O of a chip to be used for the boundary-scan testing. Match appropriate hardware (emulator) and DSP development software to the serial interface and, voilà!, you have got yourself a debugging tool.
Used systematically, the JTAG emulator is a valuable tool to help bring up and test new DSP target platforms. Think of it as your window into the hardware system, a way to save a lot of time when the hardware arrives. By methodically starting from a known good position and then migrating into the unknown, you build confidence in yourself and the test system. This time-proven method, backed with good tools, will lead to a successful DSP-based product.
Before you hook up interfaces and apply power, a few simple steps can save you a lot of grief. Inspect the board for missing or damaged components. Use an ohmmeter to check for shorts between ground and all the voltages present on the board. Remember: 'Still smoking' is not a positive state.
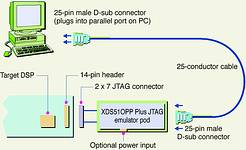
A typical test system configuration consists of a host PC used for software development, the JTAG emulator, and the DSP target (Figure 1). The hardware designer must bring out the JTAG signals from the DSP to a standardised connector located close to the processor. The connector interfaces to the actual JTAG emulator (pod). In the case of Texas Instruments' DSPs, the JTAG header is a 2-by-7 double-row header with one pin clipped for use as a key.
There are many advantages to this approach, as well as a few negatives. On the plus side, the approach is relatively low in cost because a special bond-out chip is not required - you are always working with the actual DSP - and you are able to use the same emulator across multiple TI DSP platforms and also with multiple processors on board, both homogeneous (same type) and heterogeneous (different families). Also, you can use a JTAG emulator with flash utilities to program flash memory. On top of those assets, count the fact that no target monitor is needed (that is, the approach is nonintrusive), the target can be in a chassis or enclosure, and everything is independent of processor speed and packaging.
Among the disadvantages, count a limited number of hardware breakpoints (code and data), no trace capability (though it is coming on future devices), and the fact that the target hardware must be somewhat functional before you can use it. Getting started with a JTAG emulator requires a little up-front design preparation. First, make sure the target DSP board accommodates the 2-by-7 JTAG header. The mounting can be either vertical or at right-angles, depending on the debugging environment, either standalone or in a chassis. To design this interface, refer to TI's JTAG documentation or replicate the JTAG logic used on an evaluation module or DSP starter kit board. The JTAG header should be as close to the DSP as possible. The single JTAG header can work with one DSP or multiple DSPs when the JTAG scan path is daisychained among the devices.
Next, install the debugger software (Code Composer Studio) and appropriate emulator drivers on the host development system. Then, before bringing up the new board, verify the Code Composer Studio and emulator installation by bringing up the debugging tool chain with a known working DSP target. This procedure establishes that two of the three items in the chain are functional. If so, the target is ready for its 'send-up.'
The first thing to do when debugging with a JTAG emulator is to verify the host computer-emulator-target board connection (Figure 2) - that is your first confidence level. With power removed from the target DSP board and emulator, connect the tail of the JTAG emulator to the JTAG header on the DSP board. Make sure the emulator is connected to its host computer's interface (parallel port, USB, ISA, or PCI board). Now apply power to the emulator and target. Next, launch the Code Composer Studio debugger. If it does not come up, make sure that the JTAG header is wired correctly and that the processor has a clock or is not being held in reset, and see whether the debugger and drivers are installed correctly. If the debugger comes up, it is time to develop a hardware debugging game plan. One proven strategy is to work from a known good position when investigating and proving other sections of the system. Work on-chip first, then move off-chip - that is where the JTAG emulator excels.
By using the Code Composer Studio debugger, you can verify that the chip is functional - your second confidence level. Remember, the chip was tested at the factory before you received it. Starting with the on-chip hardware, let Code Composer Studio reset the DSP and verify the default register values, read and write to all internal registers, verify memory ranges and on-chip RAM (by using pattern memory fill and read commands), and finally, verify that the I/O operates correctly.
Besides verifying the registers and memory, you can also use the debugger to verify I/O pin operation. Because many output lines are mapped into registers or memory, you can stimulate individual lines with the debugger-writing to these locations with patterns is much like memory pattern writing - and verify the levels with a scope. This is the first action to look at outside the DSP.
To test the input lines, stimulate them with a zero voltage level or Vcc and verify the values in the memory location or register by reading the values with the debugger. Once you are satisfied that the DSP is functional, it is time to look at the off-chip portion of the system - the third confidence level. Obviously, all systems possess off-chip logic, even if the software runs on-chip, and you have got to get signals on and off the DSP.
Now you are moving into new territory, where you can redeploy the debugger to verify off-chip RAM by using pattern memory fill and read commands, verify memory ranges, and verify the correct operation of the I/O.
Testing off-chip memory is a bit more challenging. You must come up with a plan to check for problems with both the address and data lines. The lines can be shorted to zero, shorted to Vcc, shorted together, or even open or not connected. Right off, you can take several cursory steps to verify the data lines: Fill memory first with all 0s and verify, then all 1s and verify, finally all 0s and verify. Alternatively, you can opt to fill memory with 0xaaaa and verify, then 0x5555 and verify.
Checking address lines also is a building-block approach. Because each ascending address line doubles the range of memory, it is best to start checking with a very small block (say, 16 words). First, fill all the available memory with 0s to clean the slate. Next, fill the memory block with a data pattern (0xffff) and look through the rest of the memory to see whether or not the same data shows up somewhere else. If it does, you have got a short. To test all of the available memory, double the block size of the data pattern and look through the rest of the memory until the usable memory size is reached.
Off-chip I/O typically consists of memory-mapped peripherals or peripherals in the I/O space. The technique used here is exactly the same as that in testing the on-chip I/O: stimulate the output lines by writing to them with the debugger and verifying the levels with a scope. To verify input lines, place a level on the lines and read out with the debugger.
OK, you see that this procedure works. Do you now have to go through it all again for your next two prototypes? Yes, but there is a better way to do it. General Extension Language, or GEL, an interpretive scripting language similar to C, lets you extend Code Composer Studio's usefulness. Basically, the idea is to put your desired interpretive debugger commands into GEL files. Listing 1 shows a sample GEL file that you can use to fill a block of memory with all 1s. Just load the file with Code Composer Studio, run the file, and quickly inspect the memory (with the debugger) for errors. A file like this can be replicated, renamed, and edited to fill any memory with data. In addition, for test purposes you can easily generate a suite of memory - fill GEL files for all three memory types - program space, data space and I/O space.
What have you gained so far? You can test and verify your system with enough confidence for the team to focus on its coding efforts. But wait. How are you going to test and debug those 20 preproduction boards coming in? (The fun does not stop, does it?) Building on your confidence about the target system, all you need do is embellish your game plan with provisions for automating the testing process. Not only does doing that get you out of the testing business, but it also compresses the time needed to test and document the procedure and allows reuse when automated test fixtures are employed for large product volumes.
Because you know the system is stable enough to write software, you can develop a software test system that enlists the Code Composer Studio development suite, GEL files, and minimal additional hardware. And you are not merely testing hardware - you are testing hardware at full speed. Any lurking hardware timing issues will be exposed.
As you go, write as much software as possible in C. Doing that helps with documentation, and the code is a lot easier to maintain. Because this will not be your last DSP project, you will want to reuse as much code as possible, and that means writing the test system in modules so that various tests can be linked in quickly.
To get going, look at what you did manually, then automate it: Note that the JTAG connection will be verified just by coming up and loading the test program. Start by writing memory tests (patterns) for both code and data spaces. Then, use loop-back connectors to allow software to generate stimulus to verify both input and output lines.
Finally, use the GEL files to reset the system, load the test program, set breakpoints for error or pass conditions, and run the code. A sample GEL file to accomplish those tasks is shown in Listing 2.
The GEL file shown should start running and stop executing by reaching one of the error breakpoints or the pass breakpoint. The operator watching the debugger screen can see which label the program stopped at. Many of the tests can be verified by not installing the loopback connectors.
Of course, you will have to debug the test program by running it in the nonautomated mode - that is, adding in test modules one at a time to build confidence in the test software as you develop it. Again, your strategy in writing test software is to start from a known good position and work your way into the suspect areas. For example, load your test code into on-chip memory, test whatever you can, and then go on to test the off-chip memory and I/O.
Where can you put this test code to work? You can use it, with a JTAG emulator and manually mounted loop-back connectors, on the test bench, and in limited production. In high-volume test situations, those using a spring pin fixture, the loopback connectors can be hardwired on the fixture, along with the JTAG emulator.
The procedure just outlined is great for RAM-based systems. What about flash memory-based systems? The technique is very similar. 'Flash' the test code into the memory (up-front step), use the GEL file to load only the symbols, put an error/pass code into a known memory location, and let the program run for a given amount of time. Examine the specified memory location for a pass/fail condition, and you are through.
Mike Strain is a cofounder of Spectrum Digital, a Texas-based producer of JTAG emulators and evaluation modules for TI DSPs. For further information about Texas Instrument products contact Avnet Kopp, (011) 444 2333, [email protected], www.avnet.co.za


© Technews Publishing (Pty) Ltd | All Rights Reserved
 printer friendly version