


RF interference signals are unwanted energy that affects the performance of a communications link. In mobile networks such as 5G new radio (5G NR), interference may impact end users and show as increased dropped call rates, lower uplink or downlink data traffic rates, or even making it impossible for users to register on the network.
Identifying the source of interference signals within mobile network deployments and operations, and then mitigating or completely removing them, is an expensive and time-consuming task. This often requires multiple teams on site with an RF spectrum analyser and directional antenna to pinpoint the origin of the unwanted signals.
Having the right set of tools can not only save time but can save money by helping reduce or completely prevent a cell from going down. EXFO’s 5GPro Spectrum Analyser is an intuitive, easy to configure solution that can be used to test physical interfaces up to 100GE, back/mid/front-haul protocols, CPRI links including RF spectrum over fibre and over the air, and timing and synchronisation.
Characteristics of interference signals
Interference signals are random by nature and can present themselves in multiple ways, they can look very similar or very different to the desired signal, have different power levels and affect the performance of the system in different ways. When characterising an RF or a microwave signal, at least three different areas need to be observed: behaviour in the frequency domain, behaviour in the time domain and the power or energy of the signal.
In the frequency domain, a signal can be wideband or narrowband, modulated or unmodulated. A modulated signal can have a fixed carrier frequency or be frequency modulated.
In the time domain, a signal can present constant power envelope or be pulsed, such as 5G time division duplexing (5G TDD).
In terms of the energy of a signal, some considerations need to be taken. The power of an RF or microwave signal (an electromagnetic field) decreases exponentially as a function of the distance to the source. A weak signal can come from a low-power nearby transmitter or from a high-power transmitter farther away.
Some examples of typical interference signals include:
• Modulated, wideband and constant power envelope (for example, 4G LTE signals in FDD, digital audio and video transmitters, cellular signal repeaters or signal amplifiers).
• Modulated, wideband and pulsed (for example, 5G TDD, WiFi and Bluetooth signals).
• Frequency modulated and pulsed (for example, RADAR: meteorological, military, aviation).
• Narrowband (for example, jammers as continuous waveform).
Typically, knowledge of the previous usage of the frequency band of operation may give some clues about the source of interference. For example, if an operator is deploying on a band that has been re-farmed, such as 700-800 MHz for terrestrial video or audio broadcast, they can expect constant envelope and wideband RF signals transmitted as per the relevant standards, such as DAB, DVB-T, DVB-T2 etc. If the band was used for private radios, then narrowband and pulsed RF transmissions can be expected.
This prior knowledge can be an important piece of information when determining if a possible interference signal is genuine or not – that is, if it is expected UE uplink traffic.
Signs of interference problems may include degraded KPIs such as:
• Increased drop call rates or bit error rates.
• Decreased user throughput in downlink or uplink.
• Decreased cell capacity, with a lower number of users per cell.
• Increased noise floor levels and received signal strength indicator (RSSI).
Figure 1 shows the transmissions from three different non-licenced devices transmitting on the UHF band, devices typically used for audio applications and available to purchase at any major retailer. These transmitters can interfere with cellular systems operating in the 700 MHz and 800 MHz bands.
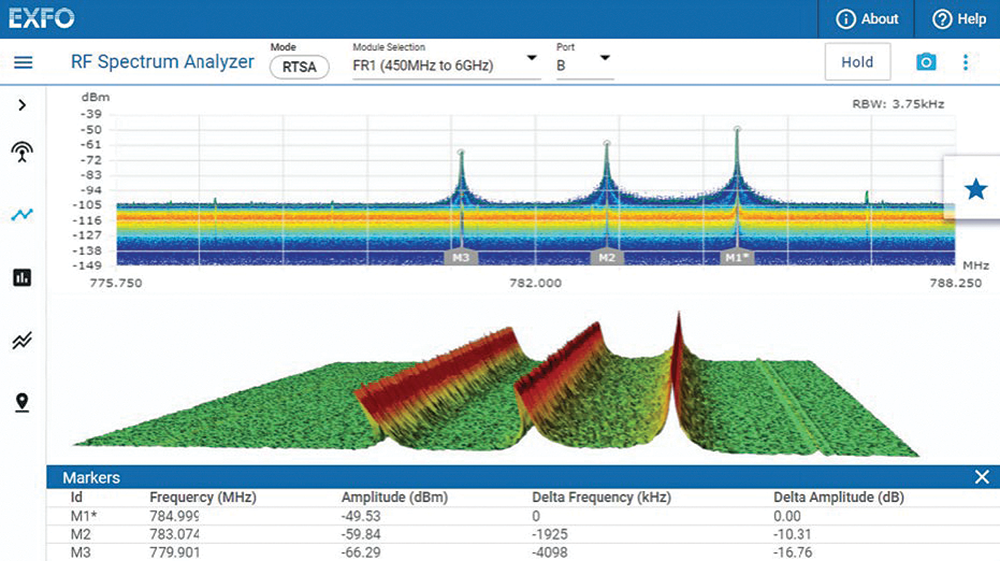 Figure 1. 5GPro Spectrum Analyser – RTSA mode.
Interference hunting in 5G
When mobile network operators are deploying a new cell site or troubleshooting, one of the key areas to observe is interference. Interference can be external or internal to the base station (for example, passive inter-modulation, otherwise known as PIM). PIM is the effect of two signals at different frequencies mixing through a non-linear component, such as an electronic circuit or even a passive component of the cell site, typically metallic or ferro-magnetic materials.
New deployments typically use the common public radio interface (CPRI) or enhanced common public radio interface (eCPRI). CPRI and eCPRI are protocols adopted by the industry to carry baseband traffic between the baseband and the radio units in both directions. If interference is internal, it will be observed over the CPRI or eCPRI interfaces, and similarly if the interference is external and present in the uplink. Interference in uplink can even ‘loop back’ and make its way out again to the downlink. However, in cellular networks, the uplink is typically more susceptible to interference than the downlink due to the large differences in transmit levels between the base station and end user equipment.
As we see more high-density deployments in 5G, along with an increasing use of low and mid-band frequencies, the chances of interference and PIM problems increase exponentially. Engineers and technicians looking at interference issues need test tools that can be used over the air and over fibre in an efficient manner – tools that are easy to operate without requiring deep knowledge of the latest standards or even RF concepts.
Three different methods for identifying interference signals can be considered:
• RF spectrum over CPRI: for measurements in baseband over the CPRI interface.
• Real-time spectrum analysis: for over-the-air RF measurements.
• Spectrum analysis in FDD or TDD with gated sweep mode: for over-the-air RF measurements.
Typically, a combination of those three modes will paint a clear picture of where interference is located, its origin (internal or external, uplink or downlink) and its characteristics (in terms of frequency and time domains, and power levels).
Users can start looking at the RF spectrum over CPRI with EXFO’s intelligent Optical RF (iORF) software to establish the characteristics of the interfering signals and their origin, and then switch to over-the-air measurements with the 5GPro Spectrum Analyser to find the location of the interfering transmitters.
RF spectrum over CPRI
Identifying interference or PIM and its underlying root cause can be very costly both in time and money. When an RF engineer or technician needs to connect an RF spectrum analyser close to the base station antennas, they require coordination across multiple teams. Typically, this also involves hiring a crane to support a tower climb which is also an expensive exercise. With new deployments using CPRI, the same technician or engineer can ‘tap’ into the optical link and get the same insight into what may be happening over the air without having to climb the tower and check the RF spectrum carried over the fibre.
EXFO’s iORF solution is the industry’s only fully automated software that can identify self-generated PIM, external PIM and RF interference in under five minutes, without requiring previous knowledge or experience with the CPRI vendor mappings or interference. The software automatically configures itself according to the optical link configuration and CPRI mappings, runs the tests and analysis, and provides a report of the results with the click of a button. The results and analysis displayed on the screen include details of the possible interference and PIM found, including frequencies, relative values and where they are generated (internally or externally).
Real-time spectrum analyser (RTSA)
Unlike a swept spectrum analyser, which can often miss fast changing signals, a real-time spectrum analyser is constantly capturing and displaying data with no blind times, and therefore, any interfering signals that appear within the configured centre frequency and analysis bandwidth will be displayed on the screen.
A spectrogram or 3D spectrogram view shows the evolution in time of the spectrum of a signal. This feature along with a ‘max hold’ trace type may be useful to find interference depending on the characteristics of the unwanted signal.
Spectrum analyser in FDD
FDD cellular deployments have constant envelope signals in the time domain (that is, they are not pulsed). Therefore, looking at either uplink or downlink spectrum is sufficient to determine if there is interference. Traditional methods for interference hunting in FDD use RF filters to attenuate uplink or downlink sufficiently, so that the other direction can be observed clearly.
For example, to look at uplink interference, an RF filter tuned to the downlink frequency band must be fitted to the spectrum analyser’s input port, so the typically higher power downlink signal does not saturate or compress the uplink signal. On FDD this is straightforward, as uplink and downlink are usually separated by a guard band, and commercial RF filters exist for the common band combinations with sufficient out-of-band roll-off performance.
Spectrum analyser in TDD with gated sweep mode
On the other hand, in TDD deployments, both downlink and uplink share the same frequency spectrum, therefore the downlink signals (typically higher power) can mask the uplink signals and even other interference signals. Furthermore, in 5G NR TDD deployments, uplink and downlink time slots can be configured according to one of many slot configurations depending on the traffic needs at any time, and the switching between uplink and downlink may happen multiple times within one 5G radio frame (every 10 ms). Typically, the spectrum displayed on the screen contains samples from both uplink and downlink time slots.
Therefore, a spectrum analyser with gated sweep support (that is, the ability of separating uplink and downlink signals transmitted on the same frequency channel at different times) is required for this job.
In gated sweep mode, the spectrum analyser displays the time domain version of the signal and allows the user to select the subframes or time slots of interest, for example the uplink slots. This is done using a time window with configurable duration and start offset.
Once the time window of interest has been configured, the user can switch back to the frequency domain and look at the spectrum of that window only. This feature enables the easy separation of uplink and downlink signals.
However, to achieve synchronisation to the beginning of the 5G radio frame, test equipment with gated sweep support requires costly and time-consuming GNSS reception, which can take over 20 minutes. EXFO’s 5GPro Spectrum Analyser can detect and synchronise to the beginning of the 5G radio frame over the RF port automatically and without the need for external GNSS reception, and usually accomplishes this task in under five seconds.
Conclusion
This application note discusses the importance of interference hunting in the deployment and operation of 5G networks. In mobile networks such as 5G NR, interference may impact end users and show as increased dropped call rates, lower uplink or downlink data traffic rates, or even making it impossible for users to register on the network. Having the right set of test tools to validate the installation, activation and operation of a cell site can save not only time, but also money, by reducing or completely preventing a complete cell from going down. EXFO’s FTB 5GPro test solution, with the modular 5GPro Spectrum Analyser, is a complete, intuitive, easy-to-configure solution that can be used to test physical interfaces up to 100GE, back/mid/front-haul protocols, and CPRI links including RF spectrum over fibre and over the air, as well as timing and synchronisation.
| Tel: | +27 12 349 1341 |
| Email: | [email protected], [email protected] |
| www: | www.lambdatest.co.za |
| Articles: | More information and articles about Lambda Test |


© Technews Publishing (Pty) Ltd | All Rights Reserved
 printer friendly version