


The ability of equipment to produce good product is fundamental to every manufacturing process. The ability to quickly setup and run a product on different process lines can make the difference in being able to satisfy a customer’s requirement, missing a delivery date, or making a profit. This process line flexibility requires good equipment with repeatability between lines to be a success. To do this, the process engineer needs to maintain his/her equipment to high standards and understand its capability.
In the 1950s, Wendell Abbott of GE wrote a detailed paper about the distribution of a measurement within a lot of material (or machine) and among lots of material that described the interactions. Although his paper is complicated, the concepts of variation within one oven and between different ovens of the same design and configuration are important when discussing flexibility across multiple SMT process lines.
Up until recently, SMT process engineers with multiple process lines needed to establish a different recipe for each reflow oven because of variations between equipment. With modern technology and control systems it is possible to adjust some reflow ovens so a single recipe will work ‘among’ ovens for an individual product. Once this is done, repeatability among ovens becomes a process tool that saves time and makes production easier. To be comfortable with control among ovens, we first need to discuss the variation within an oven.
Repeatability within an oven
Engineers are often asked how well their process meets a manufacturing specification. Phrases such as “nearly all the time,” or “the majority of the time” are not acceptable in a technical world; therefore establishing quantifiable data with measurable attributes is important. Placing a measurement or number on the ability of a process to meet a specification has evolved to what is known as process capability. This process capability measurement establishes a ratio of the process variation to a specification and is expressed as Cp or CpK.
It would be simple if we could make a single measurement of the process and compare it to the specification, but real life is not simple. Processes have variations that need to be quantified before we can make a statement about how good they are. It takes multiple samples and maths to quantify process variation.

If we want to be 100% confident of the variation of a process we would need to measure every piece. But that is impractical, so we use sampling and statistics to estimate the variation in a process. As you can guess, choosing the sample size becomes an issue of time and cost versus the accuracy of the data. We do not intend to turn this into a statistics course, but will give a simple overview of the concepts and how we can apply the concepts to an SMT reflow oven.
Since process capability is a comparison of the process output to a specification, both need to be identified. In the case of a reflow oven, the specification is usually the reflow profile supplied by the paste manufacturer. It consists of ramp rates, soak time to traverse specific temperature ranges, time above the liquidus of the solder, and the peak temperature.
The process output includes two pieces of data for each specified attribute. The first is the average and the other is the standard deviation. The average is simple maths (addition and division), while calculating the standard deviation is more complicated. Spreadsheets, statistical programs, and some calculators can do the analysis for us without the need for manual calculations (consult statistical handbooks and texts for a detailed explanation of standard deviation). What process engineers need to know is that the standard deviation of sample data predicts the process variability.
The process-to-specification ratio can be expressed in two ways: one is called Cp and the other is CpK. The difference is that Cp focuses on machine capability while CpK focuses on the process for an individual product. Cp uses the tolerance range and standard deviation without regard to the actual target to determine if the machine has the ability to make good product. The tolerance range is usually set to an industry standard. On the other hand, CpK uses Cp calculations and the actual target to ensure the process meets the specification for an individual product.
The calculations are:
• Tolerance range = upper specification limit minus the lower specification limit.
• Cp = (tolerance range)/(6 times the standard deviation).
• CpK = Cp times (1 minus K).
• Where K = the absolute value of the target minus the mean divided by half the total tolerance range.
Let’s say that we have the following peak temperature data:
• The specification given by the paste manufacturer is 240°C ± 10°C.
• Therefore the target is 240°C with a tolerance range of 20°C.
• After running ten profiles, we found that the average peak temperature is 238,5°C.
• The spreadsheet calculations tell us that the standard deviation is 0,34.
• Therefore the Cp would be 20/(6 x 0,34) = 9,8.
• K would be (240,0 – 238,5)/10 = 0,15.
• Then the CpK is 9,8 x (1 – 0,15) or 8,33.
Statisticians tell us that when the machine capability (Cp) is 2,0 or greater, we have a capable process regardless of the process centre. They also say that for a process to be in control, the CpK has to be 1,33 or greater accounting for the process centre. In this case the Cp and CpK are excellent.
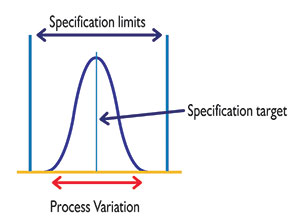
To help make it clear we can look at the accompanying figures. Figure 1 depicts a perfectly centred process with the target and process average equal to each other. The statistical process variation is well within the specification limits and has a 1,33 CpK. This allows for some movement of the average while the product remains within the specification.
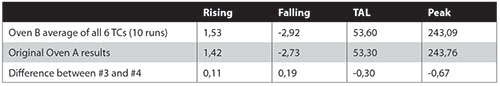


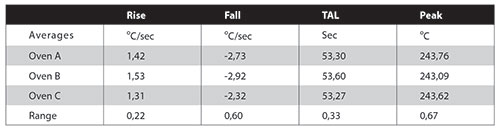
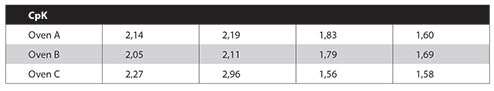
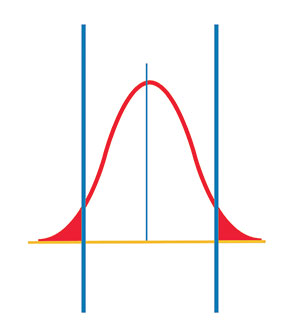
Figure 2 shows a centred process, but the variation is larger than the specification limits. When this happens, the process is producing conditions where some of the product is outside of the specification window. In this case the CpK is about 0,8.
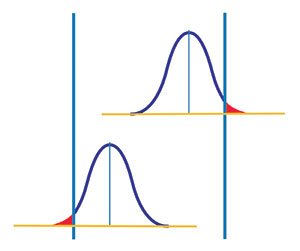
Figure 3 shows two processes that have variation less than the specification limits, but they are not centred. While the Cp (not considering the target) would be good, the processes are producing conditions where the product is outside of the specification window. If they were centred they would be okay. The CpK in these cases is about 0,85.
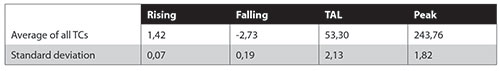
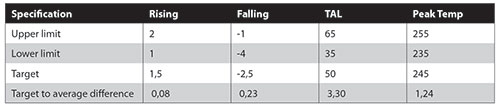
Now, let’s look at the results from a study of an actual reflow process that was conducted over a 5-day period. Profiles were taken each morning and afternoon on a 10-zone reflow oven that was running a lead-free solder recipe. The product was a 350 gram board with 6 TCs attached to critical components.
The ramp, TAL, and peak temperature data from each run was put in a spreadsheet to calculate the averages and standard deviations. The results are in Table 1. Comparing results to the lead-free solder specification, we see that the averages are very close to the targets (Table 2).
This indicates that the recipe is correct for this product, but this does not specify the process variation. Not knowing the variation reminds us of the guy that had one hand in boiling water and the other in an ice bath; he was uncomfortable but on the average the temperature was okay. Thus we need to know the variation of the process. Since we are taking a sample and not measuring the profile for every part, we can use the standard deviation of a sample and the formulas previously discussed to calculate the CpK.
The results of these CpK calculations are in Table 3. It clearly shows us that the process is in statistical control, because the CpKs are all above 1,33. Therefore, if the process specification is correct, the reflow process is making good product. (Note: this study was conducted over a 5-day period but the same can be done with 10 consecutive runs in one day.
Repeatability among ovens
Now that we know one oven is in control, how do we show that the process is in control among multiple ovens with the same recipe?
We could obtain a single profile on a second oven to show that it is within the process widow identified by the paste specification. But that would not verify that the second oven had the same process variability as the first and we could be deceiving ourselves into thinking the process was in control. The answer is again in statistics and CpK.
We could complicate our decision making with statistical evaluations such as the Student’s Test and Mr. Abbott’s calculations, but it is possible for the process engineer to keep it simple by comparing the results of CpK calculations on multiple ovens to show that there is repeatability between them.
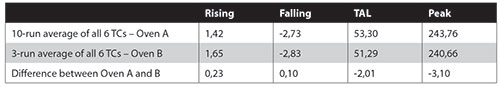
Before we start the 10 runs on the second oven, we need to fine tune or adjust the profile by using TC offset in the oven control program. To obtain the offset, we need to run a few profiles on the second oven (we’ll call it Oven B) and compare it to the averages we produced on the first oven, Oven A. We are tuning the oven, not calculating the CpK. Although we could get more accurate data with multiple runs on oven B, we chose three runs in an effort to save time.
The peak temperature and TAL are slightly lower on Oven B, so if we use an offset in the oven control of 3°C to increase the peak temperature, the TAL should be slightly longer.
Then, obtaining profile data with the offsets from 10 runs in Oven B and calculating the averages, we get the results in Table 5. The small differences in the averages between Oven A and Oven B tell us that we chose the correct offsets. If they are not small we can modify the offsets again.
Then, using the same process specification targets that we used for Oven A and the standard deviation from the Oven B data to calculate the CpK of Oven B, we get the results in Table 6. Both the comparison of the averages and CpK confirm that Oven A and Oven B are in control with the same recipe.
Table 7 shows the same for yet another oven (C) – with an identical product, offset procedures, set points, and specification limits. Therefore, we have three ovens using the same recipe that are all in control. This allows us to say that we have repeatability among them.
Let’s do a quick review by comparing the data from the three ovens, shown in Tables 8 and 9.
The first thing we see is that the rising, falling, TAL and peak temperature averages are very close to each other, thus we have the correct tuning offsets. The second and most important is that every specified attribute is within control because the CpKs are greater than 1,33.
We have proven that we have repeatability within each oven and among the three ovens, and the process engineer can be confident that he can produce good product in any of the three reflow ovens.
This article focuses on helping the process engineer run a single recipe on multiple ovens of the same design and configuration across their facility or among different facilities. In some cases a t-test is used to confirm that there is not a significant difference between each oven. The t-test uses a null hypothesis statistical tool that determines if they are significantly different from each other.
| Tel: | +27 11 869 0049 |
| Email: | [email protected] |
| www: | www.mykaytronics.co.za |
| Articles: | More information and articles about MyKay Tronics |


© Technews Publishing (Pty) Ltd | All Rights Reserved
 printer friendly version